Ad Hoc Analysis and OLAP Tools
Why do organizations go with an ad hoc analysis approach along with OLAP tools? It's important for organizations to consider a broad spectrum of data to make relevant, informed decisions.
In an enterprise reporting environment, it is crucial for organizations to utilize an ad hoc analysis approach along with OLAP tools. Disregarding or missing key information can have adverse effects on any organization.
In order to perform a successful and effective analysis on a data set, new and unclear questions should always be answered without hesitation because it's so easy to ignore. To simplify the process, ad hoc analysis and OLAP tools assist in answering anything unclear.
At InetSoft, our powerful and intuitive business intelligence solutions guide the process of ad hoc analysis by using OLAP tools. Users will have the ability to analyze multi-dimensional data from different perspectives while answering questions along the way.
How Ad Hoc Analysis Coexists With OLAP Tools
Ad Hoc Analysis
Considered a common practice in business intelligence, ad hoc analysis provides users with answers to specific questions that haven't been touched upon or discovered. It is advantageous in the enterprise reporting environment as it allows users to explore reports more in depth while being cost efficient and effective.
Because an initial static report can be vague and miss details, ad hoc analysis may be used to drill deeper into those static reports to get data that hasn't been brought to the table. Additionally, the process of doing an ad hoc analysis can be to create reports that don't already exist, getting details about accounts, transactions, or records from it. The result of an ad hoc analysis can consist of statistical models, analytic reports, or other types of data summary.
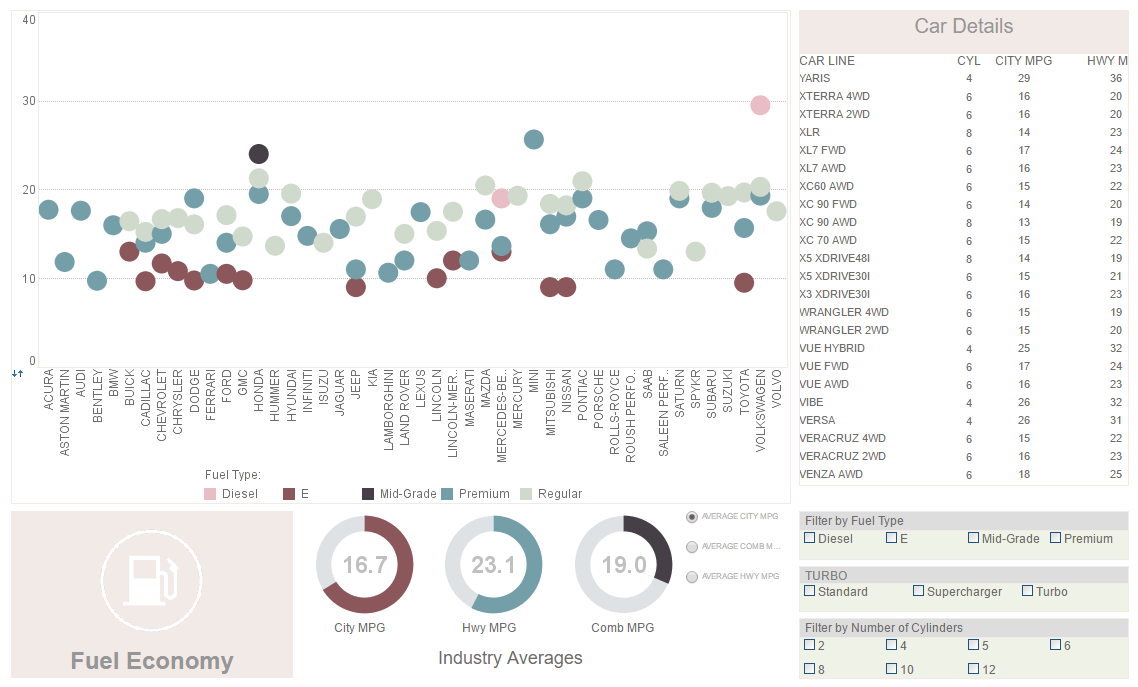
InetSoft's in-report exploration and ad hoc reporting tools enable this analysis. What makes InetSoft stand out compared to other vendors is the maximum self-service enabled in the area of ad hoc analysis via end-user defined data mashup. Users are able to combine data within a single data source or across multiple data sources into unified data sets using union, intersection, minus, inner/outer joins, etc. The self-service aspect includes our simple drag-and-drop interface, a unique capability on our StyleBI product.
The key advantages of InetSoft's InetSoft's Ad Hoc solution:
- Easy to use, minimum training
- Low IT investment and overhead
- The ability to leverage existing infrastructure
- More affordable than Power BI or Tableau
- Cloud-flexibilty of deployment
OLAP Based Tools
OLAP tools enable users to interactively analyze multidimensional data from multiple perspectives. They are specifically designed to facilitate ad hoc analysis by providing quick and easy access to data from an original report. Users can immediately access data by using a point-and-click interface. This cuts down asking different divisions and/or departments for separate data in a pressing situation.
Because OLAP plays an intricate part in traditional business intelligence, at InetSoft, we ensure to bring quality performance. We support OLAP tools with a special XMLA data source type. Furthermore, we provide an integrated OLAP front-end that allows business users to tap into this rich source of data.
The key advantages of InetSoft's OLAP solution:
- The ability to leverage a data warehouse investment
- High performance
- The ability to mashup OLAP data with other sources
InetSoft's rich ad hoc analysis options empower business users of all skill levels by providing the OLAP server tools necessary to access insightful information.
More Articles About Reporting
Acceptance Rate for Insurance - Insurance reimbursements are a common source of funding for mental health treatments. As a result, it is crucial to assess your insurance acceptance rate. This measure reveals the proportion of patients with insurance coverage and those who must pay out-of-pocket. You may find possibilities to grow your insurance network and increase your income by monitoring this KPI. You may also recognize patients who might want financial support and create initiatives to assist them. The amount of money a patient spends on their mental health therapy is known as the average treatment cost. This KPI takes into account all treatment-related expenses, such as those for therapy sessions, medications, and other services. You may spot patterns in treatment cost trends and create cost-cutting initiatives by monitoring this KPI. This statistic may also be used to evaluate the efficacy of your treatment plans and identify which ones are most beneficial to patients...
Crowdsourced Data Analytics - Contemporary consumers leave digital footprints all over the Internet, particularly on social networks and websites. It's a huge privilege for healthcare companies because they can discover the latest trends and draw meaningful information directly from the source, i.e. from the crowd of consumers and/or patients...
Problems When Creating Reports - Report-making is another area likely to be influenced by human factors, and this is one of the biggest challenges that has been experienced. Any job done manually can be prone to some error. Errors can result from manual data entry and analysis regardless of the skill level of the professional. This could result in erroneous decisions being made based on conclusions deduced from such information. This is very worrisome in scientific analysis. This work is a serious, time-consuming procedure that includes the collection, storage, and analysis of a considerable amount of data to develop reports. This entails learning and verifying the information, constructing tables, graphs, and data modeling. A single laboratory produces hundreds of results of experiments per day, and the entire information flow must be processed and reflected in a report. This work consumes a lot of time and resources and needs to be done faster to produce results...
Resort Management Dashboard Example - Occupancy rates are one of the core KPIs shown on resort management dashboards. This measure provides light on how available rooms and lodgings are being used. Managers are better able to anticipate demand, pinpoint peak seasons, and adjust price by monitoring occupancy rates over time. A low occupancy rate could force management to modify their advertising strategies or take into account special incentives, whilst a high rate might point to a successful marketing campaign or a well-attended event. Resorts may better match their resources with demand and run more profitably by keeping an eye on and analyzing occupancy rates...
What Is a Grant Management Dashboard? - Before doing anything else, you must understand what a grant management dashboard is. These tools offer a single place to view, analyze and share your grant's key metrics. A visualization dashboard provides the most intuitive way to understand information, which is crucial for something as highly regulated as grants. Having all the data you need in one place makes it easier to spot and address errors or alarming trends before they cause larger problems. It also makes it easier to give other parties, like your grantor, a complete picture of your operations, which is important for transparency. Real-time reporting features take these advantages further...


