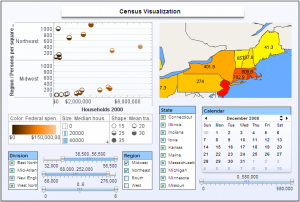
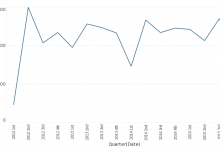
 Big data is becoming more common inside organizations of all sizes, which has given rise to a greater need for data visualization tools than ever before. The business of big data is growing so fast that by the end of this year, the rate of data production worldwide is anticipated to hit 5.6 zettabytes, which is more than twice the growth rate of a few years ago (source: http://data-informed.com/top-5-business-benefits-using-data-visualization/). But raw data itself does not tell a story, which is why tools need to be used to break it down and present it to an audience. The benefits of BI tools and data visualization are being used in the business world everywhere from team meetings to board rooms, allowing users to:
1. Segment & Manipulate Data
The easy segmentation and manipulation of data is one of the main benefits of data visualization tools, which makes it very easy to isolate and present data that is relevant to a particular business group, segment or team to craft a presentation that will be meaningful for participants. It is also a benefit in that users can find, observe and analyze data on their own to make business decisions without having to rely on data teams to pull that data for their use, which leads to significant business efficiencies.
2. Effectively Engage an Audience
Data visualization makes presenting to a group much easier because it is far more engaging than simply using static data information. Cameron Graham explains, “In essence, data visualizations provide real insight into complex information in a way that is both practical and appealing” (source:http://smartdatacollective.com/cameron-graham/284206/how-data-visualization-can-benefit-smbs).
3. Interact with Data Directly
The interactive nature of real-time data visualization also allows for the reworking of assumptions and forecasts on the fly during meetings as questions arise, which is something that people appreciate and value from a business perspective. With the ability to make data appealing through visualization, it is easier to get buy-in when planning, forecasting and running market tests.
4. Absorb Complex Information
Scientific studies have determined that the human brain can analyze and process images faster than text, which is a main reason why data visualization is so effective. By translating data into a rich graphical representation rather than a chart, list or data set audiences are more likely to absorb complex information.
5. Identify Relationships & Trends
Because the human brain is so keenly attune to visual cues, it is easier for people to draw connections and understand relationships between information when it is presented visually. Data visualization, therefore, can help a user or team to establish cause-and-effect relationships more easily, which aids in testing and subsequent analysis.
Brian Gentile puts it simply when he says, “Organizations that use visual data discovery are more likely to find the information they need when they need it and do so more productively than other companies” (source: http://data-informed.com/top-5-business-benefits-using-data-visualization/#sthash.9M7pybJF.dpuf).


