-

Explore Your Data with Multidimensional Visualization
Read moreDon’t let your charts be limited to just what’s on the X and Y axes. With multidimensional visualization, you...
November 8, 20240 -
InetSoft’s Data Visualization Software Helps Fight Human Trafficking
Read moreInetSoft helps non-profits such as the Anti-Human Trafficking Intelligence Initiative utilize data visualization technology to save crime victims. Recently...
-

What KPIs and Analytics Are Used on Earthwork Estimating Software Dashboards?
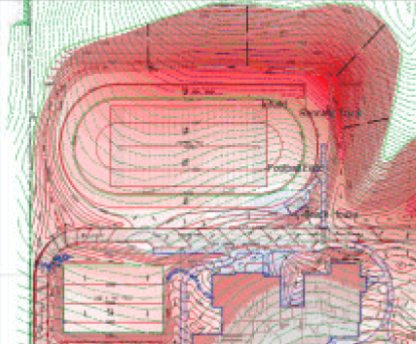
Read moreThis article discusses earthwork estimating software dashboard KPIs and analytics, showing how they help construction professionals make educated choices...
-

Definition of a Sparkline Chart
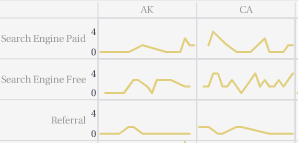
Read moreThis page will discuss the uses of Sparkline Charts, show you how to create them in InetSoft, and provide...
-

How to Make a Sunburst Chart in InetSoft
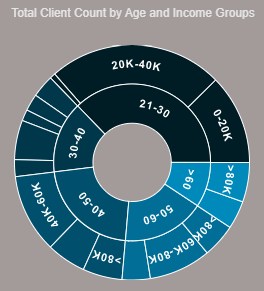
Read moreThis page will discuss the uses of Sunburst Charts, show you how to create them in InetSoft, and provide...
