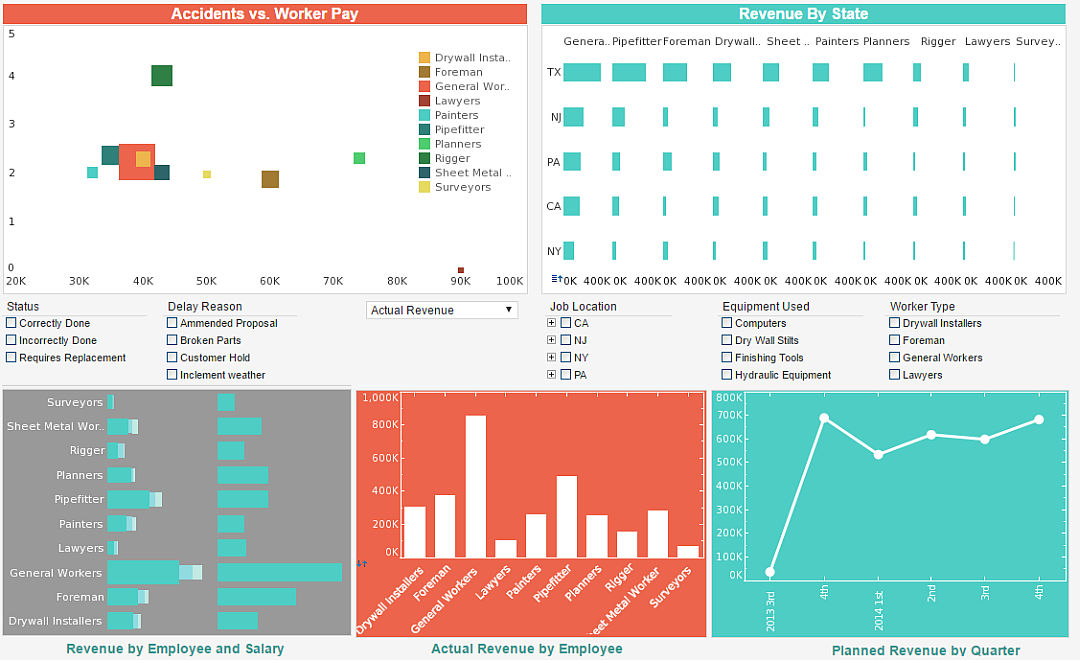
Data aggregated into report tables or calculations done with Excel formulas can be difficult to draw real insights from. InetSoft’s data illustration tools help non technical users take complex data and visually create new levels of understanding. Read more here.

