-

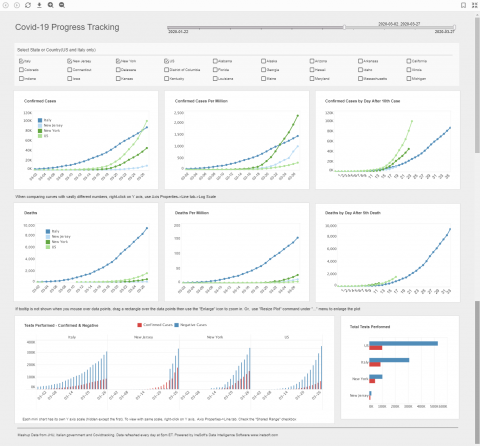
InetSoft Creates Live Data Dashboard for Coronavirus Tracking
Read moreThis Covid-19 tracker mashes up data from a few different sources to give views that aren’t found in the...
March 29, 20201 -

BI for Project Management: Keep Your Team on Schedule with a Gantt Chart
Read moreProject management, or the process of optimizing team workflow in order to properly meet deadlines, has grown from a...
-

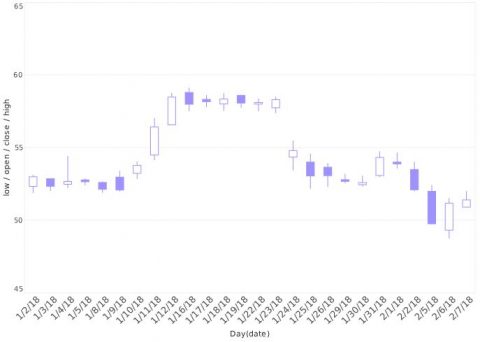
Tracking Financial Asset Fluctuations with Candlestick Chart Analysis
Read moreIn previous posts, we’ve discussed how different charts are more effective for different purposes, with bar charts and scatter...
-

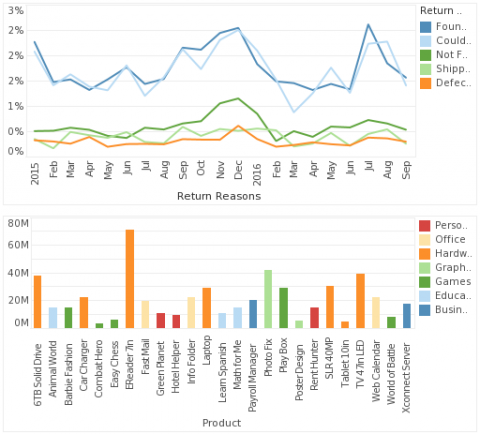
Back to the Basics, Part 2: Using Sortings and Rankings to Analyze Data with Many Distinct Values
Read moreIn a previous post, we discussed how adding just a few aggregate KPI’s to your dashboards can provide much...
-

An Additional Dashboard Color Tip: Keep Your Measures Distinct From Your Dimensions
Read moreWe’ve covered questions such as what kind of color palette to use in dashboard creation, how many colors to...
