-

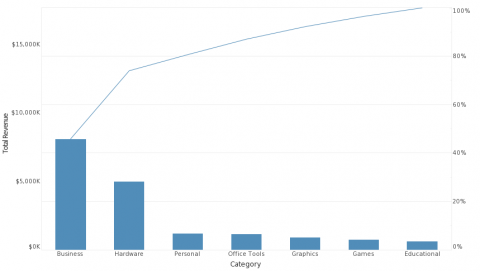
Reading Proportionality Clusters with a Pareto Analysis Chart
Read moreIn a Mashup post last year, we discussed how using a waterfall chart instead of a pie chart can...
May 24, 20180 -

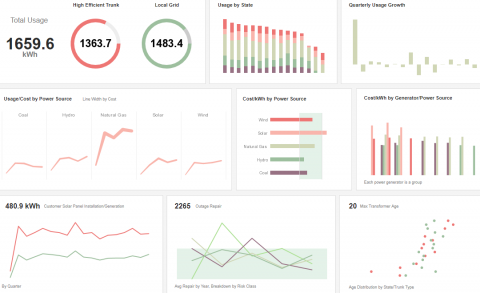
Power Management Dashboard Example
Read moreHaving real time, up to date utilities analytics helps power companies and other utilities properly manage their resources and...
-

IT Services Provider EuroSpace Selects InetSoft’s Style Scope for Travel Expense Data Management Solutions
Read moreThe EuroSpace Travel Management Portal, which currently boasts over 70,000 users, will now feature InetSoft powered BI dashboard tools...
-

How can BI help app developers make better decisions?
Read moreThis new InetSoft page explores the way that our visual reporting tools can help app developers measure success and...
-

Laying out a dashboard for mobile devices
Read moreWith InetSoft you can create customized views of your dashboards for mobile devices! Find out how here https://www.youtube.com/watch?v=yzUjiPUBYB0
