Balanced Scorecard Examples
InetSoft's business intelligence software is equipped with balanced scorecards that allow for up to the minute monitoring and alerts. Users can create custom scorecards that keep track of the key performance indicators over time, and alerts them to both rapid and gradual changes in performance.
Results are then shared with other users easily and quickly, ensuring that the organization's most crucial data reaches decision makers without delay. Common balanced scorecard examples include scorecards that monitor finances, customer interaction, internal business processes, and employee training.


What KPIs and Metrics Are Tracked in Legal Case Win-Loss Scorecard?
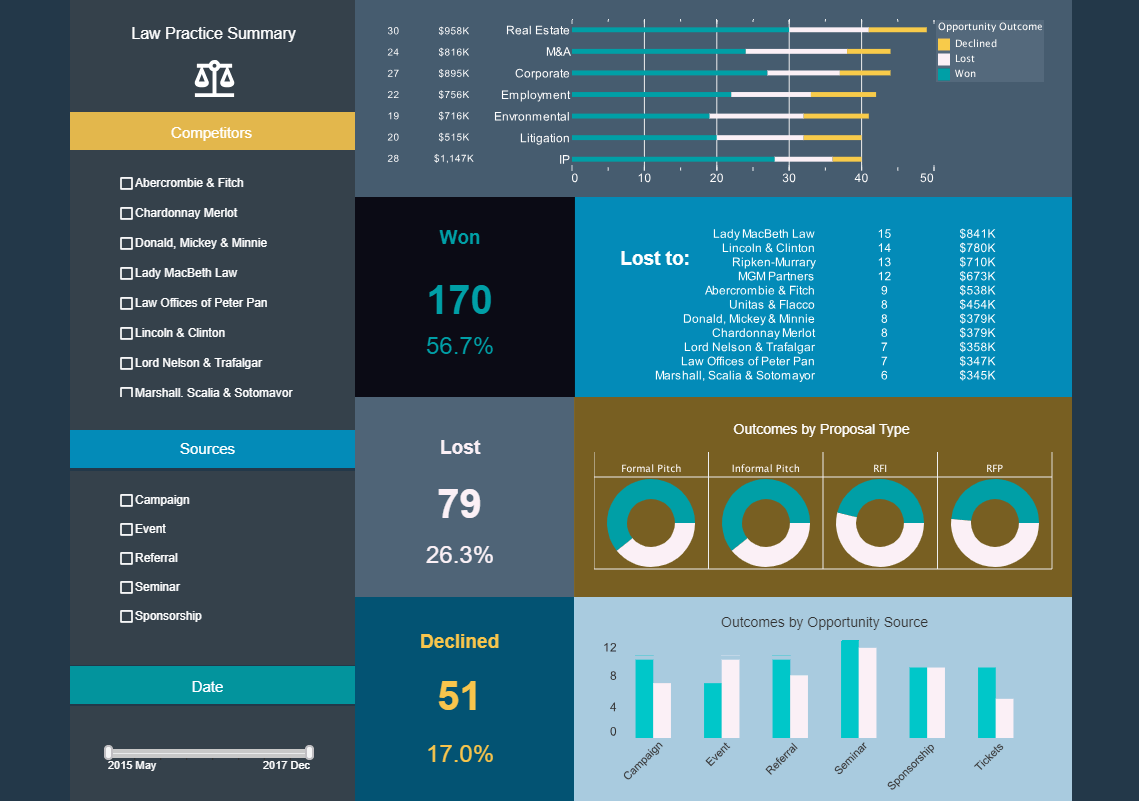
In the legal industry, a win-loss scorecard is used to evaluate the outcomes of legal cases and assess the performance of legal teams and strategies. Tracking key performance indicators (KPIs) and metrics in a legal case win-loss scorecard helps law firms and legal departments understand the factors contributing to success or failure in litigation and identify opportunities for improvement. Some of the essential KPIs and metrics tracked in a legal case win-loss scorecard include:
-
Case Outcome: The most fundamental metric is the outcome of the case—whether it was won, lost, settled, or dismissed. Understanding the overall success rate provides a baseline for evaluating performance and identifying trends over time.
-
Success Rate by Case Type: Analyzing success rates by case type or practice area helps identify strengths and weaknesses in specific areas of legal expertise. It also enables firms to allocate resources effectively and focus on areas where they have a competitive advantage.
-
Time to Resolution: Tracking the time it takes to resolve legal cases from initiation to conclusion helps assess efficiency and productivity. Longer resolution times may indicate inefficiencies in case management, litigation tactics, or court delays.
-
Cost Management: Monitoring costs associated with legal cases, including attorney fees, court costs, expert witness fees, and other expenses, is crucial for financial management and budgeting. Analyzing cost metrics helps identify opportunities to control expenses and improve profitability.
-
Client Satisfaction: Gathering feedback from clients on their satisfaction with legal services provided helps gauge the quality of representation and client relationships. Client satisfaction metrics can include satisfaction surveys, client reviews, and client retention rates.
-
Win-Loss Reasons: Understanding the reasons behind winning or losing legal cases provides insights into the effectiveness of legal strategies, evidence presentation, witness testimony, and other factors influencing case outcomes. Common win reasons may include strong legal arguments, favorable evidence, persuasive advocacy, or favorable rulings. Loss reasons may include weaknesses in legal arguments, insufficient evidence, adverse rulings, or procedural errors.
-
Settlement Rates: Tracking the frequency and outcomes of settlements helps evaluate the effectiveness of negotiation strategies and the ability to achieve favorable outcomes outside of court. Settlement metrics can include settlement amounts, terms, and success rates compared to litigated cases.
-
Legal Precedent and Case Law: Analyzing legal precedent and case law relevant to each case helps inform legal strategy, anticipate potential outcomes, and assess the strength of legal arguments. Tracking precedential cases and their impact on case outcomes provides valuable insights for future litigation.
-
Litigation Strategy Effectiveness: Assessing the effectiveness of litigation strategies, including case preparation, legal research, motion practice, discovery, and trial advocacy, helps identify best practices and areas for improvement. Metrics related to strategy effectiveness may include success rates, motion outcomes, and trial verdicts.
-
Case Complexity and Risk Assessment: Evaluating the complexity and risk associated with each case helps prioritize resources and allocate staffing accordingly. Metrics such as case complexity scores, risk assessments, and likelihood of success ratings provide valuable insights for strategic decision-making and resource allocation.
More Articles About Scorecards
Capabilities of the Student Performance Dashboard - Monitor, explore, and analyze by filtering and sorting desired information Easy to use, modify, and create charts and visuals Leverage user-driven data mashup...
Excavation Volume vs. Target - This statistic contrasts the volume of excavation that actually occurred with the aim that was set. A departure from the anticipated volume may indicate impending delays or inefficiencies, necessitating immediate remedial action...
Patient Lifetime Value (PLV) - A predictive statistic called patient lifetime value calculates the total amount of money a healthcare facility may anticipate making from a patient over the course of their relationship. It considers the mean income produced over time by a patient's visits, treatments, and services...
Top Strengths Assessment - Now those areas where you have white on your top strengths assessment chart, it may be that there is no process or that there is no relationship between that particular strategic value and that position. Those areas where you have yellow, well those would be the areas where you may not have some training materials or where you not have identified the skills or where you do not have provided the skills to that workforce...
