How Dashboard Software Can Drive Efficiency in the Energy and Utilities Sector
How data intelligence can improve performance in the energy and utilities industries
The energy sector is one of the planet's most vital, powerful, and lucrative industries. From commercial and residential power to agricultural and industrial supply, energy providers keep almost every facet of the world ticking.
While the energy and utilities sector is critical to modern-day function, it is often plagued with inefficiencies that lead to a number of issues concerning sustainability, ethics, process, and cost (which, more often than not, falls onto the shoulders of the consumer).
As an energy provider, remaining responsive in the face of constant challenge while protecting your brand reputation is no easy feat. But with an analytic business intelligence mindset and the dashboard software to fortify your strategic decisions, you can connect with insights that will empower you to mitigate a wealth of situations with confidence.
Here, we look at how dashboard software can power up the energy and utilities sector, giving providers and large-scale businesses the tools to improve in every key area of the organization.
| #1 Ranking: Read how InetSoft was rated #1 for user adoption in G2's user survey-based index | Read More |
The current state of the energy and utilities sector
In Europe especially, there is an energy price crisis. Fuelled by the rising cost of gas and coal prices-hikes that have impacted electricity prices-consumers as well as businesses are feeling the pinch.
The existing Ukraine conflict has further seen energy prices soar by 200% since Vladimir Putin declared war in March 2022. These pressing factors, coupled with a mass transition towards sustainable energy and away from pollutant fossil fuels, have created a volatile playing field for those operating in the sector.
The necessity to reduce operational costs while finding more wallet-effective yet sustainable energy sources for consumers has never been more pressing.
Remaining robust and adaptable to continual change is vital to survival in today's energy sector. As such, operating with insight is the only way to find light in the darkness.
Analytic business intelligence will facilitate effective strategic planning while significantly enhancing real-time decision-making which brings us to our next point.
How data intelligence can improve the energy and utilities sector
Dashboard software has the features and functionality to power up the energy and utilities industry in a number of key areas. Here, we're going to explore how the best reporting software, coupled with an analytic business intelligence mindset, can improve the sector.
Data consolidation and digitization
Such a complex and multi-faceted industry requires access to data that is reliable, cohesive, accurate, and easy to analyze.
From an industrial to a consumer-facing level, many leading energy and utility companies are lagging behind when it comes to data intelligence.
Utilizing modern data dashboards facilitates the effective digitization, storage, and processing of critical data related to every process, operation, or department imaginable. This level of consolidation and visual analysis will break down data silos, giving everyone in the organization access to the insights they need to perform at an optimum level.
When everyone has access to an interactive control panel populated with all of the data-driven insights they need, communication and productivity will soar, driving accelerated levels of growth in the process.
Energy resource management
Next, let's explore the matter of energy resource management. Powered by cutting-edge dashboard software, energy companies and providers can use predictive data to forecast future demand while understanding where to place their resources year on year.
Armed with interactive visual data, it's possible to see (at a glance) where attention is needed and where operational improvements are necessary. In turn, this will result in significantly less wastage as well as a level of improved financial efficiency that drives growth, improving customer loyalty in the process.
Another key benefit of improved energy resource management through analytic business intelligence is the fact that by improving strategic efficiency based on accurate projections, utility suppliers and providers can operate in greener, more sustainable ways.
 |
Read the latest news about InetSoft's user friendly BI software and customer successes. |
Energy and utilities storage strategy
In such a volatile, delicate, and ever-shifting landscape, energy storage is a pressing matter. As the sheer amount of stored energy continues to skyrocket, many providers are in need of larger or more amenable facilities to optimize their efforts.
Storing sustainable energy is incredibly difficult, as energy production is typically periodical and often lacks clear-cut patterns or structure. As such, data software is required to measure energy storage and provide the insight required to understand capacities as well as specific requirements during particular weeks or months of the year.
With the right BI software, you can also identify sustainable opportunities to scale storage capacity effectively and ultimately accelerate the growth of the business using controlled, progressive strategies.
Trend and pattern prediction
Another vital perk of working with BI software and adopting a data-driven culture is trend and pattern recognition.
As the best reporting software is powered (at least in part) by machine learning (ML) technology, it's possible to connect with data-driven discoveries that you would otherwise miss with traditional analytical tools or processes.
Working with dynamic visual key performance indicators (KPIs), it's possible to drill down into trends or patterns that are refined by autonomous technologies. By doing so, it's possible to visually compare, analyze, and map out strengths or weaknesses in your processes or operations.
If you own a hydroelectric power facility, for example, you could work with dashboard software visualizations to monitor the efficiency of your wind turbines. Here, you can identify the times when your turbines produce the most energy in correlation to specific weather conditions, gaining an understanding of when to lean on your hydroelectric generating output.
As a result of spotting such a vital pattern, you can make strategy tweaks that save money while improving output-a magic combination for any energy or utility provider.
 |
Read the top 10 reasons for selecting InetSoft as your BI partner. |
Failure or disaster prevention
Gaining the ability to identify key trends or patterns with ease also helps energy companies or providers avoid potential catastrophe.
When it comes to any form of energy, an operational disaster or failure usually results in colossal financial losses at best and high-scale harm or danger at worst. That said, gaining the ability to identify any patterns that appear irregular or unusual is critical to any business operating within the energy industry.
For instance, the devastating California wildfires that spread widespread destruction in 2018 are strongly believed to be caused by faulty power lines. If the owners or facilitators of the power lines in question were equipped with the right BI software, they may have been able to spot any irregular trends, functionality or overloads and taken direct action before disaster occurred.
Failure or disaster recognition works on every level, from minor to large scale. The point here is: armed with the right visual data, consolidated in an interactive dashboard, you will gain a panoramic vision of every core operation, enabling you to respond to almost every eventuality with speed and accuracy.
"Information is the oil of the 21st century, and analytics is the combustion engine."-Peter Sondergaard
Energy and utilities dashboard software in action
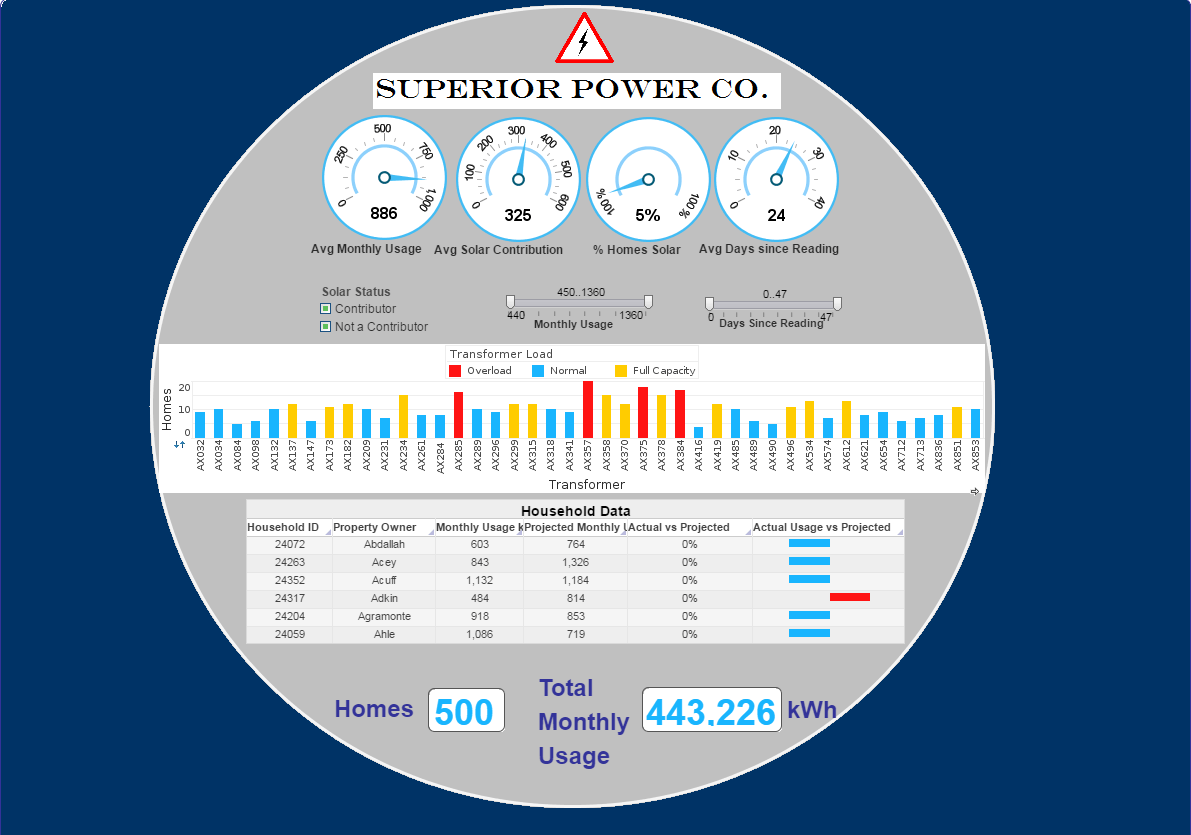
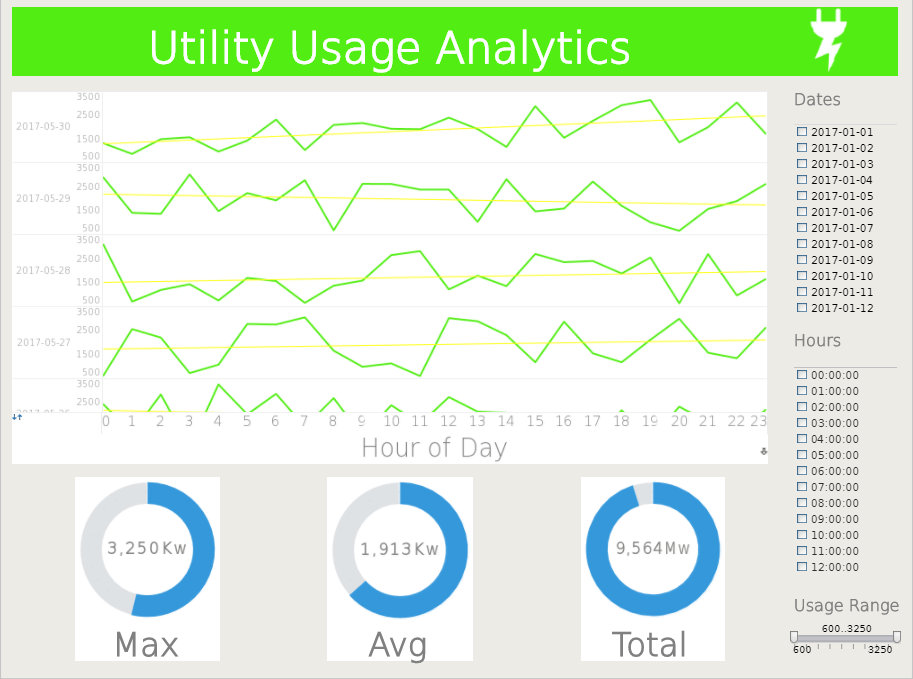
Now that we've covered the key ways that dashboard software can power up the energy and utilities sector, we're going to look at our power management example.
Focused on generation and distribution, this dynamic piece of BI software is ideal for energy and utility providers as well as businesses that consume large levels of energy across sites or branches.
Designed with clear cut visual KPIs as well as easy-to-navigate data filter functionality, you can drill down into a wealth of emerging trends and patterns in moments.
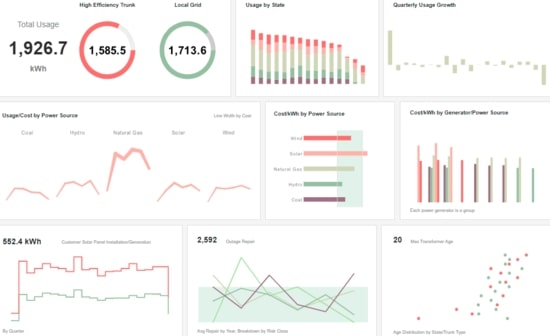
This balanced and insightful energy data dashboard also offers deep-dive information into a broad range of critical areas, including local grid usage, outages, quarterly user growth rates, power sources, energy transformer age, and more.
This cohesive melting pot of information exists to inspire informed decision-making while formulating targeted strategies concerning resource distribution and energy generation at its core, driving growth and evolution in the process.
 |
View the gallery of examples of dashboards and visualizations. |
In conclusion...
"Without a systematic way to start and keep data clean, bad data will happen." -Donato Diorio
The energy sector is under strain. Whatever your function, component, or mission within the industry, working with maximum data efficiency is the only way forward in today's landscape.
Without the ability to nip potential issues in the bud, continually improve your processes at scale, benchmark your success, and evolve with the changes around you, failure is inevitable. There is little margin for error or room for complacency in the energy and utilities sector, which means that you must maximize the value of the insights you have at your disposal.
Harness the power of analytic business intelligence to your advantage, and you will thrive long into the future, no matter what is thrown in your path.
We hope you found this illuminating. For more insights into the universal power of dashboard software, read our exploration of business intelligence in education.
SOURCES:
Energy & Utility Dashboards | iDashboards Software
Artificial Intelligence (AI) in the Energy Sector: Opportunities and Challenges - Intellias
 |
Read how InetSoft was rated #1 for user adoption in G2 Crowd's user survey-based index. |


