Quick Examples of Dashboards
Below is the transcript of a Webinar hosted by InetSoft on the topic of New Features in Version 12 of InetSoft's StyleBI BI Software. The presenters are Mark Flaherty, CMO at InetSoft, and Ceci Puth, Product Manager at InetSoft.
Ceci Puth (CP): One of the new features in version 12 is that it uses the information about the underlying schema from your database to warn about possible double-counting. So as soon as I added the aggregation on number in stock, it made quantity and total grayed out. I can try to include these in my table, but it may cause double-counting.
So for instance, let me try to add this now. It warns me with a pop-up. A trap is detected that could result in double-counting and inflate the value of the aggregates. Of course, I can override this, if I know what I am doing, or I can back out and undo that last change.
If I actually open up the model, this is based on this physical view, let me open up the physical view, and here is where the cardinality and connectivity between the tables is defined. We will actually automatically detect this, so when I drag from Category ID to Category ID, notice that it detects this as being one-to-many.
| #1 Ranking: Read how InetSoft was rated #1 for user adoption in G2's user survey-based index | Read More |
I can also go into the Properties here and change the cardinality between these tables, one-to-one, many-to-many etc. So that's essentially what I wanted to show on the desktop side in Style Studio. Now I am going to transition into the Web browser.
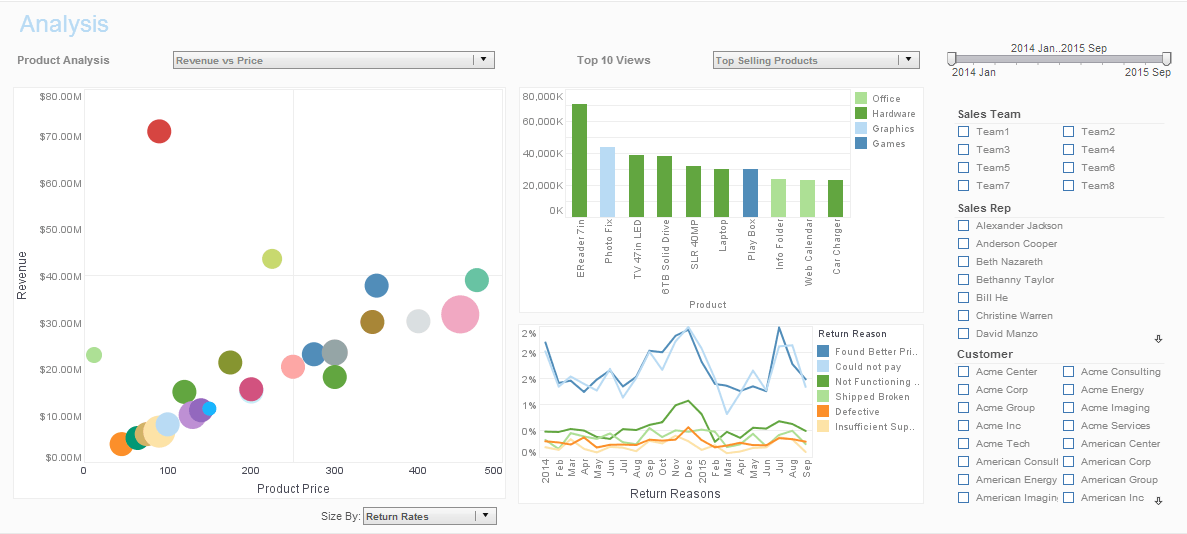
I just have a couple of quick examples of dashboards to show here. These are just giving you some idea for what can be created on the visualization side of the product. The next dashboard here that I am going to show will also allow me to illustrate one of the new features in version 12.
So here we have the sales information from different angles like Geography, Category, Sales Person and Time. I can do filtering and brushing and all kinds of operations to update all of these charts on the fly. Additionally, end users, as I am acting as one right now, can modify how items are displayed in a chart.
 |
Read the top 10 reasons for selecting InetSoft as your BI partner. |
How A Category Manager Uses Dashboards To Optimize Sales And Profit By Geography
Category managers play a pivotal role in optimizing sales and profit by geography within retail organizations. They are responsible for managing product categories, analyzing market trends, and implementing strategies to maximize revenue and profitability across different regions. Dashboards are indispensable tools for category managers, providing real-time insights and actionable data to make informed decisions and drive business growth. Here's how category managers use dashboards to optimize sales and profit by geography:
-
Geographic Sales Performance Analysis: Dashboards allow category managers to visualize sales performance metrics, such as revenue, units sold, and average transaction value, across different geographic regions. By comparing sales data from various locations, category managers can identify high-performing regions, emerging markets, and underperforming areas. They can drill down into specific regions to analyze sales trends, customer demographics, and purchasing behavior, enabling them to tailor product assortments, pricing strategies, and promotional campaigns to each geographic market's unique needs and preferences.
-
Market Share and Competitive Analysis: Dashboards provide category managers with insights into market share, competitive positioning, and share of shelf across different geographies. By monitoring competitor activity, pricing dynamics, and product assortment strategies, category managers can identify opportunities to gain market share and differentiate their offerings. Dashboards enable category managers to track their brand's performance relative to competitors in each geographic market, allowing them to adjust marketing tactics, promotional activities, and product positioning strategies to maintain a competitive edge and maximize sales and profit.
-
Inventory Management and Supply Chain Optimization: Dashboards help category managers optimize inventory levels, replenishment cycles, and distribution strategies based on geographic demand patterns and sales forecasts. By analyzing inventory turnover rates, stockouts, and lead times across different regions, category managers can ensure that the right products are available in the right quantities at the right locations to meet customer demand effectively. Dashboards enable category managers to identify supply chain inefficiencies, logistics bottlenecks, and inventory imbalances by geography, allowing them to implement corrective actions and improve operational efficiency while minimizing costs and maximizing profitability.
-
Promotional Effectiveness and Campaign ROI: Dashboards enable category managers to track the effectiveness of promotional campaigns, marketing initiatives, and sales incentives by geography. By monitoring key performance indicators (KPIs) such as promotional lift, return on investment (ROI), and incremental sales, category managers can evaluate the impact of marketing spend on sales and profit outcomes in different regions. Dashboards allow category managers to segment promotional performance by geographic market, product category, or customer segment, enabling them to identify which promotions are driving the highest ROI and optimize future marketing investments accordingly.
-
Customer Segmentation and Targeting: Dashboards facilitate customer segmentation and targeting strategies by geography, allowing category managers to identify high-value customer segments, purchase patterns, and preferences in each region. By analyzing customer demographics, behavioral data, and purchase history, category managers can tailor marketing messages, product recommendations, and loyalty programs to specific geographic markets. Dashboards enable category managers to monitor customer engagement, retention rates, and lifetime value by geography, enabling them to identify opportunities to attract new customers, increase purchase frequency, and drive cross-selling and upselling initiatives to maximize sales and profit.
| Previous: Demonstrate Creating a New Report |


