Report Builder
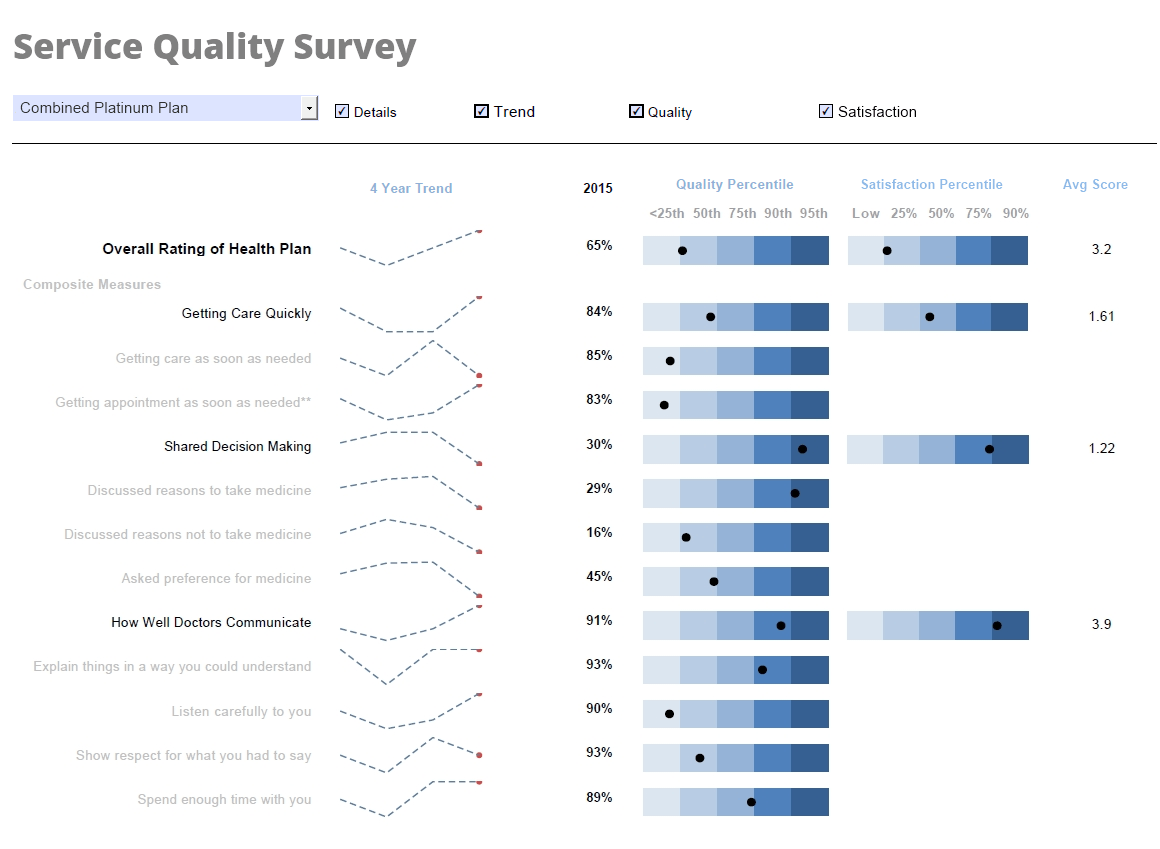
Since 1996, InetSoft's report builder has helped analysts and developers save time by providing tools that pair report design aspects like report layout, elements, and scripting with robust data capabilities that include data mashup, and real-time reporting and publishing.
Building reports with InetSoft is...
Easy- Experience a shallow learning curve for business users; only Excel-level skills needed
- Makes it easy for analysts & administrators; no SQL experience required
- Scales up with zero-client deployment and no per-user licensing
- Provides maximum self-service through ad hoc and visualization analysis
- Enables self-service also at data level: end-user defined data mashup
- Address advanced and mass needs
- Run on a high performance, secure infrastructure
| #1 Ranking: Read how InetSoft was rated #1 for user adoption in G2's user survey-based index | Read More |
What Does a Kinesiologist Look at in Data Reports?
Kinesiologists, who specialize in the study of human movement and biomechanics, analyze various types of data reports to assess and improve physical performance, prevent injuries, and optimize rehabilitation programs. Here are some key aspects that kinesiologists typically examine in data reports:
-
Biomechanical Data: Kinesiologists analyze biomechanical data captured through motion capture systems, force plates, wearable sensors, or video analysis software. This data provides insights into joint angles, muscle activity, forces, and movement patterns during physical activities such as walking, running, jumping, or lifting. By examining biomechanical data, kinesiologists can identify movement abnormalities, asymmetries, or inefficiencies that may contribute to injury risk or performance limitations.
-
Kinematic Parameters: Kinesiologists evaluate kinematic parameters such as velocity, acceleration, range of motion, and joint kinematics to assess movement quality and efficiency. Kinematic data helps kinesiologists understand how individuals move and adapt to different tasks or environments, enabling them to identify factors that may impact performance or contribute to musculoskeletal injuries.
-
Muscle Activation Patterns: Kinesiologists analyze electromyography (EMG) data to assess muscle activation patterns during physical activities. EMG data provides information about the timing, intensity, and coordination of muscle contractions, allowing kinesiologists to identify muscle imbalances, weaknesses, or compensatory strategies that may affect movement performance or predispose individuals to injury.
-
Gait Analysis: Kinesiologists conduct gait analysis to assess walking or running patterns and identify abnormalities or asymmetries that may impact gait mechanics or contribute to musculoskeletal injuries. They examine spatiotemporal parameters such as step length, cadence, and stance phase duration, as well as kinematic and kinetic variables such as joint angles, ground reaction forces, and moments.
-
Performance Metrics: Kinesiologists use performance metrics such as speed, power, agility, endurance, and strength to evaluate physical performance and track progress over time. They analyze performance data from fitness tests, functional assessments, or sport-specific evaluations to identify strengths, weaknesses, and areas for improvement in individuals or athletes.
-
Injury Risk Factors: Kinesiologists assess various factors that may increase the risk of musculoskeletal injuries, such as poor movement mechanics, muscle imbalances, overuse patterns, or inadequate conditioning. They analyze data reports to identify modifiable risk factors and develop targeted interventions, such as corrective exercises, neuromuscular training, or ergonomic modifications, to reduce injury risk and improve performance.
-
Rehabilitation Progress: Kinesiologists monitor rehabilitation progress by tracking objective measures such as range of motion, strength, flexibility, and functional capacity. They use data reports to evaluate the effectiveness of rehabilitation interventions, adjust treatment plans as needed, and guide individuals through the recovery process to optimize outcomes and return to pre-injury levels of function.
More Articles About a Report Builder
Choosing the Right Workflow Dashboard - When selecting a workflow dashboard, it's essential to consider your specific needs and requirements. There are numerous choices on the market, each with specific characteristics and capabilities. Some popular workflow dashboard tools include: Trello Asana Monday.com Jira Basecamp Before making a decision, evaluate each tool's features, integrations, user interface, and pricing plans. To make an informed decision that fits your workflow and business goals, look for reviews and suggestions from reliable sources...
Dashboard Solution for Progress DataDirect - With any business intelligence solution, it is important to have full access to all relevant data and information within a company. These data sets are stored in databases where dashboard reporting software can retrieve and compile information in order to build data visualizations and/or analytical reports...
Emergency Resource Allocation Analytics - Efficient distribution of resources is a fundamental aspect of emergency management. Dashboards for emergency management integrate many metrics to guarantee optimal resource allocation. Among these analytics are: Resource Demand Forecasting: Based on event severity and past data, predictive analytics may calculate the demand for resources such as staff, medical supplies, and housing. This aids in the authorities' proactive crisis preparation. Resource Utilization Optimization: Emergency managers can maximize the use of resources on the ground by using data analytics...
 |
Read the top 10 reasons for selecting InetSoft as your BI partner. |
InetSoft's Project Reporting Tools - For successfull delivery of projects, project managers must utilize all project related data, for example, supply chain and issue tracking system data. These systems are normally scattered. Some third party data may even be in Excel files. InetSoft's data mashup makes data processing a light-weight, business user self-serviceable process with great efficiency...
Tools for Online Client Reporting - Visualization dashboards are the most intutive ways to understand client information. However, not all dashboards are created equal. InetSoft's web app can easily connect to client data to create self-service dashboards with rich built-in interactivity and customization...


