The Top 14 Analytics Software Features in 2025


Data analysis involves the collection, synchronization, archival, and presentation of information (InetSoft para.3). Organizations require effective data analytics tools to enhance decision making, improve consumer relations and increase their competitiveness.

The effectiveness of data analysis tools depends upon additional features incorporated into their design as a means of enhancing their various uses. The following is a list of the top 14 analytics software features to consider:

Estimated Reading Time: 12 minutes
#1 Ranking: Read how InetSoft was rated #1 for user adoption in G2's user survey-based index Read More

Governability

Governability is a data analytics feature that ensures that the decisions made in an organization promote the quality, security, and integrity of data. With this feature in place, an organization is capable of complying with data security and privacy regulations in a manner that encourages the implementation of internal data standards (Information Resources Management Association 1129). For instance, during the construction of analytics frameworks, an organization has an obligation to track the origin and properties of the various data sets required. In this regard, the governability feature of analytics software enables the organization to detect latent biases within such data sets that have the potential to alter expected results.

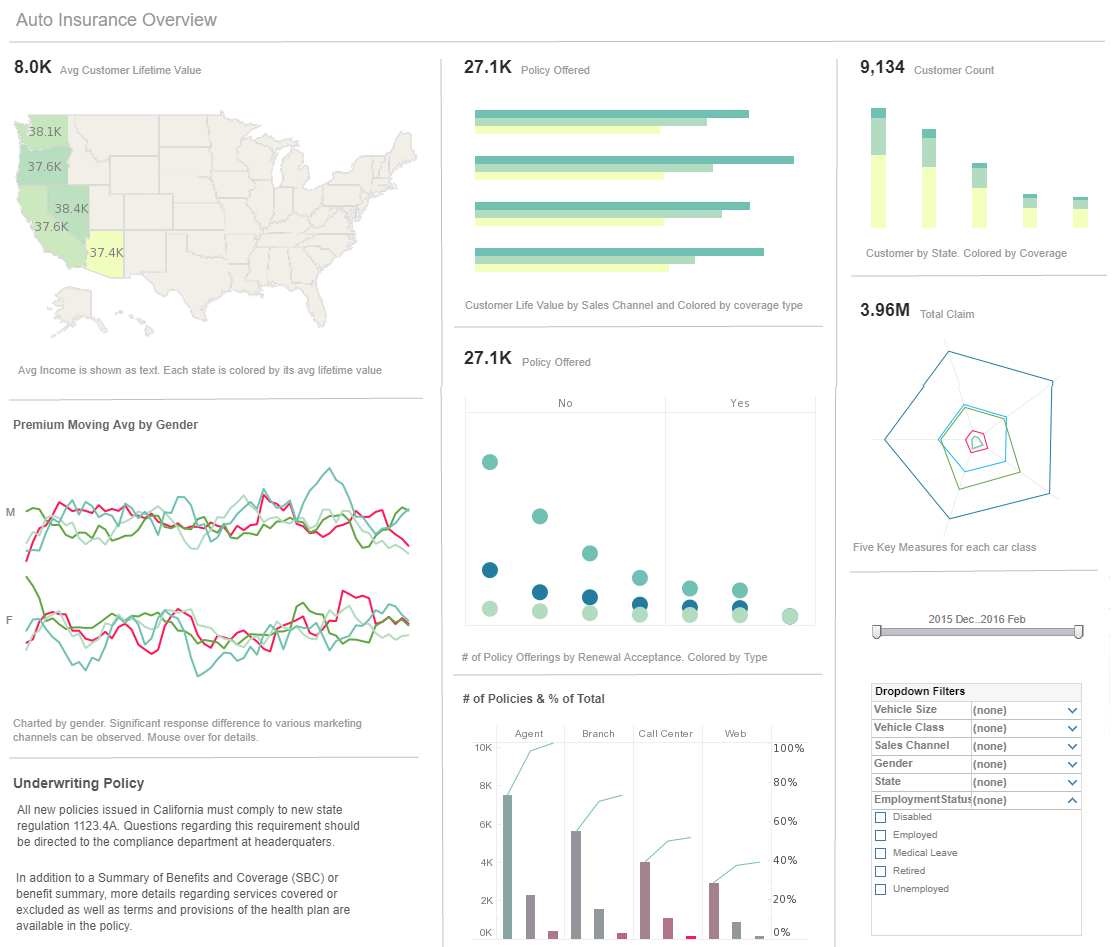
The importance of a governability feature is seen in cases where an organization has to make decisions based on sensitive data like insurance policy records without violating any privacy regulations put in place.

Read the top 10 reasons for selecting InetSoft as your BI partner.

Manageability

The manageability of data analytics software is another feature that enhances the efficiency of such tools. The continuity and standardization of data documentation require analytics software to have an effective data management platform (Shalin 134). Examples of such platforms include Adobe, Cloudera, and Salesforce DMP. When these platforms are integrated within analytics software, an organization is able to build specific data profiles for informed decision-making.

The need to develop data profiles is brought about by the volume and variety of information that enterprises encounter in their day-to-day operations. Information management platforms enable an organization to harmonize big data by developing data profiles. As a result, data visibility is improved thereby enhancing their access for prompt decision making. For this reason, analytics software is being engineered to promote manageability by integrating features such as push notifications which alert system users of decisions taken by an organization.


Scalability

Big data presents decision-makers in an organization with a broad range of problems that require solutions for the enterprise's sound operation. To handle increasingly large amounts of data, data analytics software must be scalable (Svolba, 122). Scalability, in this regard, is a feature of analytics software that involves the tool's ability to increase its data handling capacity. Consider a scenario where an enterprise needs short term workers. Such an organization will have to scale its analytics software to accommodate the functionalities of an expanded payroll system. Scalability implies that when the company no longer requires casual laborers, they can readjust the payroll framework.

Analytics software scalability promotes a seamless user experience without incurring the effects of system downtime. In addition, an enterprise whose analytics software is scalable often increases its rates of customer retention, which ultimately translates to an increased flow of revenue.
Read the latest news about InetSoft's user friendly BI software and customer successes.

Data Integration Simplicity

Data integration is a phenomenon that involves the combination of various data sets in an organization with the intent of producing a unified perspective of a particular issue. For example, the phenomenon may be observed whenever an enterprise engages in consumer data integration for the purposes of enhancing consumer service delivery, reporting, and analysis (Information Resources Management Association 1144).

Typically, the organization relies on data subsets of individual consumers from line departments such as accounts, marketing, and sales in order to develop a unified perspective.

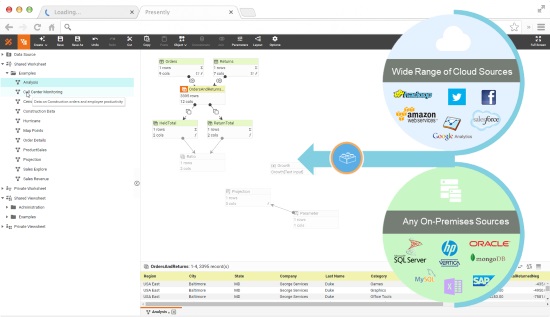
For this reason, data integration simplicity is an essential feature that analytics software ought to exhibit. Typically, companies are required to script protocols that Extract, Transform and Load (E.T.L.) data for unification. However, analytic tools such as Zoom exhibit data integration simplicity with their built-in ETL protocols. The feature enables rapid sharing of analytics within an organization.


Mungibility of Data

Also known as data wrangling, data munging is an information transformational concept where raw data is converted into formats that are usable. The concept may be likened to the wrangling of animals such as horses, where the wrangler acquires a wild horse and tames it for racing purposes. In the case of data munging for an enterprise, raw data is collected, assembled, and transformed into a format that can be analyzed as business intelligence (Shalin 30). In the absence of an automated system, an organization can spend a lot of time preparing raw data for transformation. Ergo, analytics software with features that facilitate the mungibility of data reduces the time that an organization requires to transform raw data for interpretation purposes. Examples of analytics software with features of data mungibility include Datameer, Altair, and Paxata.

Read what InetSoft customers and partners have said about their selection of Style Report as their production reporting tool.

Data Security

Perhaps one of the most important features of analytics software is data security. In the internet age, data is an extremely valuable asset for trade. As a result, there is a need to guarantee its security (Svolba, 135). In most cases, enterprises are compelled to place multiple layers of security over their various data sets and sometimes this measure inhibits engagement with analytics data.

For this reason, analytics software shall have in-built data security features. With such features in place, the tools are able to synchronize all possible security events on all the devices in an organization with minimal needs for a human interface, thereby promoting uninterrupted data analysis.


In addition, analytics software with built-in data security features enables a company to share information without violating any information privacy regulations that may be in place such as the Payment Card Industry Standard. Lanscope Stealth Watch is an example of analytics software with in-built security features. Plus, when you interact with real-time information, you can avoid costly catastrophes.


Multifunctionality

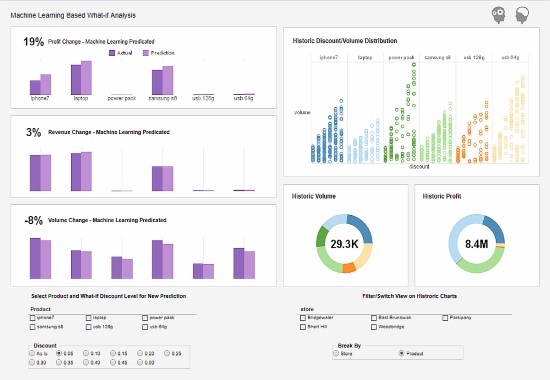
Analytics may be categorized as descriptive, predictive, and/or prescriptive. The results of each category contribute to the overall performance of an organization. An effective analytics software, in this regard, is one with features that enable it to be multifunctional in performing the three categories of analysis mentioned (Information Resources Management Association 1298). The multifunctionality feature of such a tool may examine past trends in an organization while simultaneously making forecasts regarding the possible actions an organization might take.

In addition, the software should also provide possible advice on the advice the trajectory that an enterprise or entity should take. A typical example of such software is observed in the machine learning of self-driving cars. Analytics software employed in such scenarios enables a self-driving vehicle to overtake another based on data that is to its rear and its front and the logical action to make for its progress.

demo
Read how InetSoft saves money and resources with deployment flexibility.

Explorability of Data

The objective of data analysis is the provision of comprehensive and insightful perspectives about an organizational situation. As such, data analysis requires an exploration of all the possible areas of interest that shed light on the state of affairs in an organization (Shalin 81). The exploration of a wide array of data during analysis provides decision-makers with a broader perspective of the issues of interest for decision-making purposes. Through exploration of data, analysts are able to establish patterns with pre-existing information and thus simplify a number of business solving processes in an enterprise. Evidently, data exploration reduces the work-time for decision-makers in an enterprise. Therefore, analytics software shall have features that facilitate the explorability of data as a mechanism of enhancing their utility.


Version Controllability

With data analysis, the parameters of analytical frameworks are bound to be adjusted from time to time. Unfortunately, these adjustments tend to be problematic despite the noble intentions behind them (Svolba, 177). In order to eliminate the occurrence of these problems, it is essential for information system operators to record these adjustments in order that the adjusted versions of an analytical framework may be recalled whenever they may be required. The concept is known as version control. Take the example of a web designer who has to make several adjustments to the layout of the user interface of a website but might require previous versions later.

A version control system enables them to access the original version of the user interface layout and make necessary comparisons with an adjusted version. Analytics software with such kinds of version controllability act as a mechanism of data insurance in the event that an analytical error may cause the distortion of data.

dashboard demo
View a 2-minute demonstration of InetSoft's easy, agile, and robust BI software.

Processing of Data

In its raw form, data has no relevance to an organization. For this reason, such data has to be transformed into usable information. The transformation is known as data processing (Information Resources Management Association 1126). Data processing supplements analysis by generating readable formats of information such as charts. As a result, enterprises become more competitive through the adoption of workable business strategies. However, there is a need to streamline data processing and analysis on one platform. Analytics software with features that support the processing of data enables an enterprise to install data pipelines.

These pipelines facilitate the operationalization of analytics frameworks. The repetitious nature of data analysis requires instantaneous data processing for the enrichment of usable information. Apache Spark is an example of analytics software that has the dual function of analysis as well as supporting the processing of data.

Data Visualization

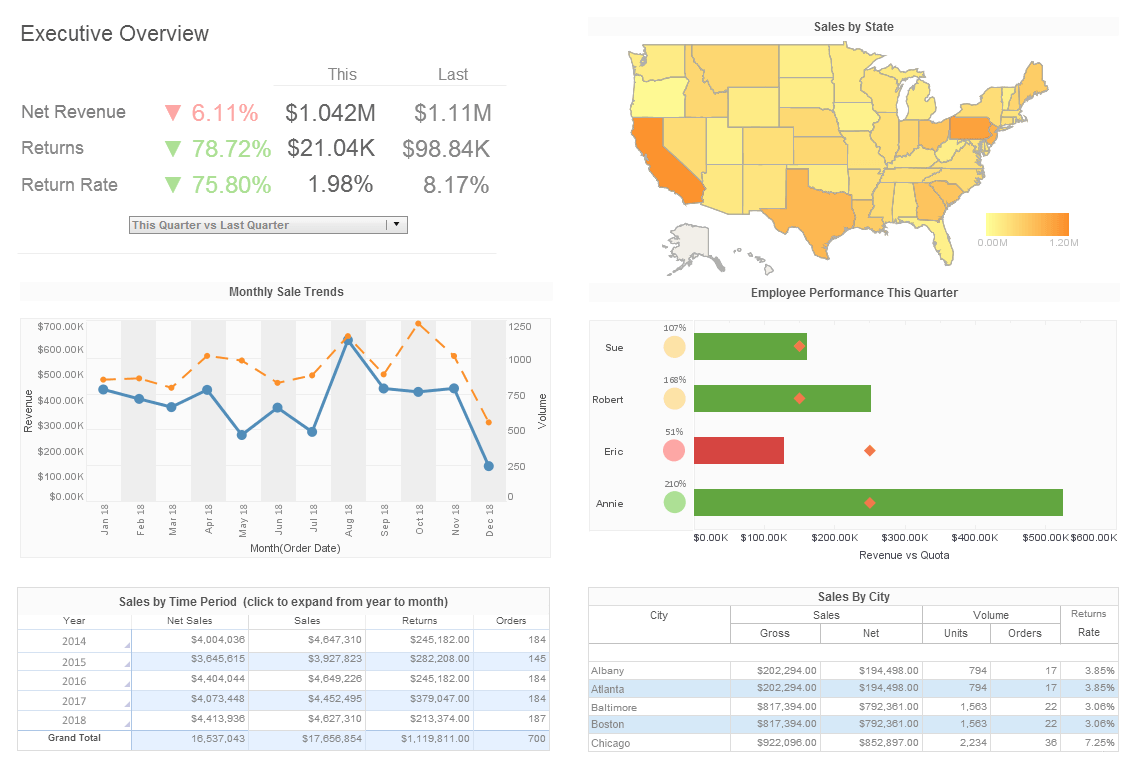
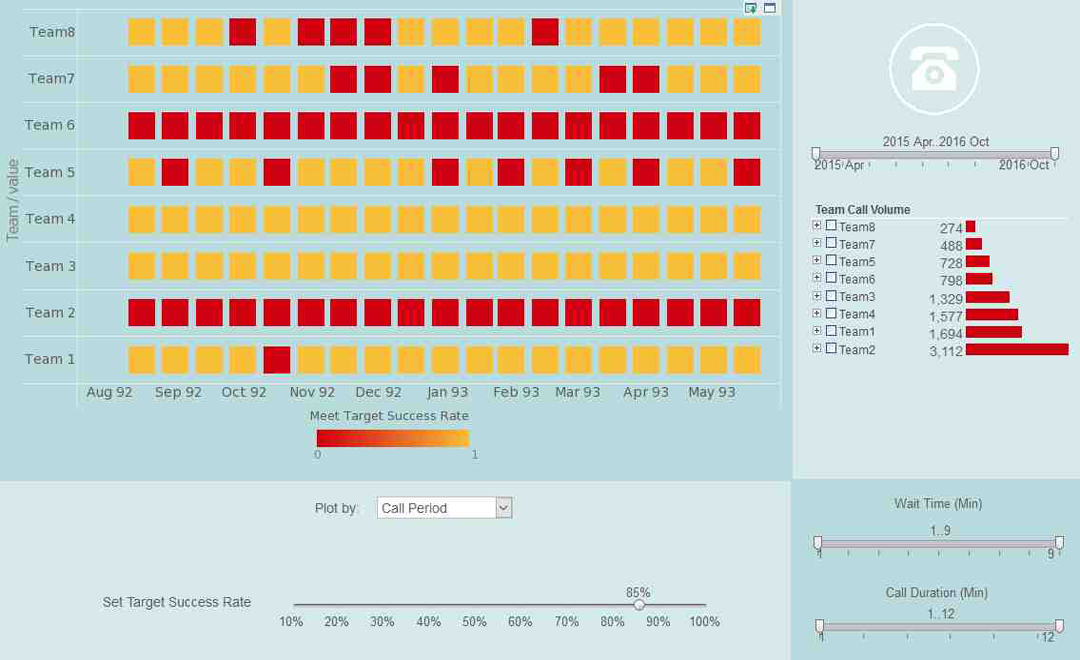
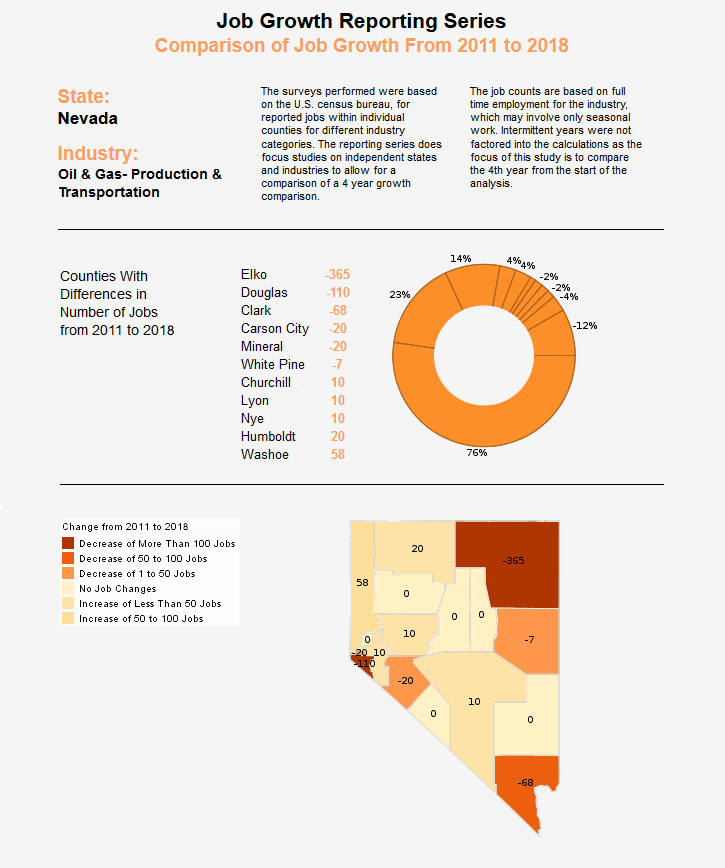
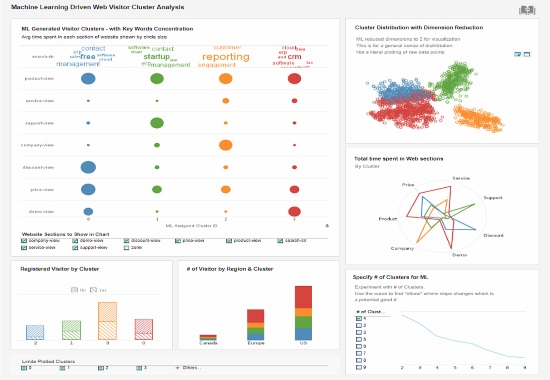
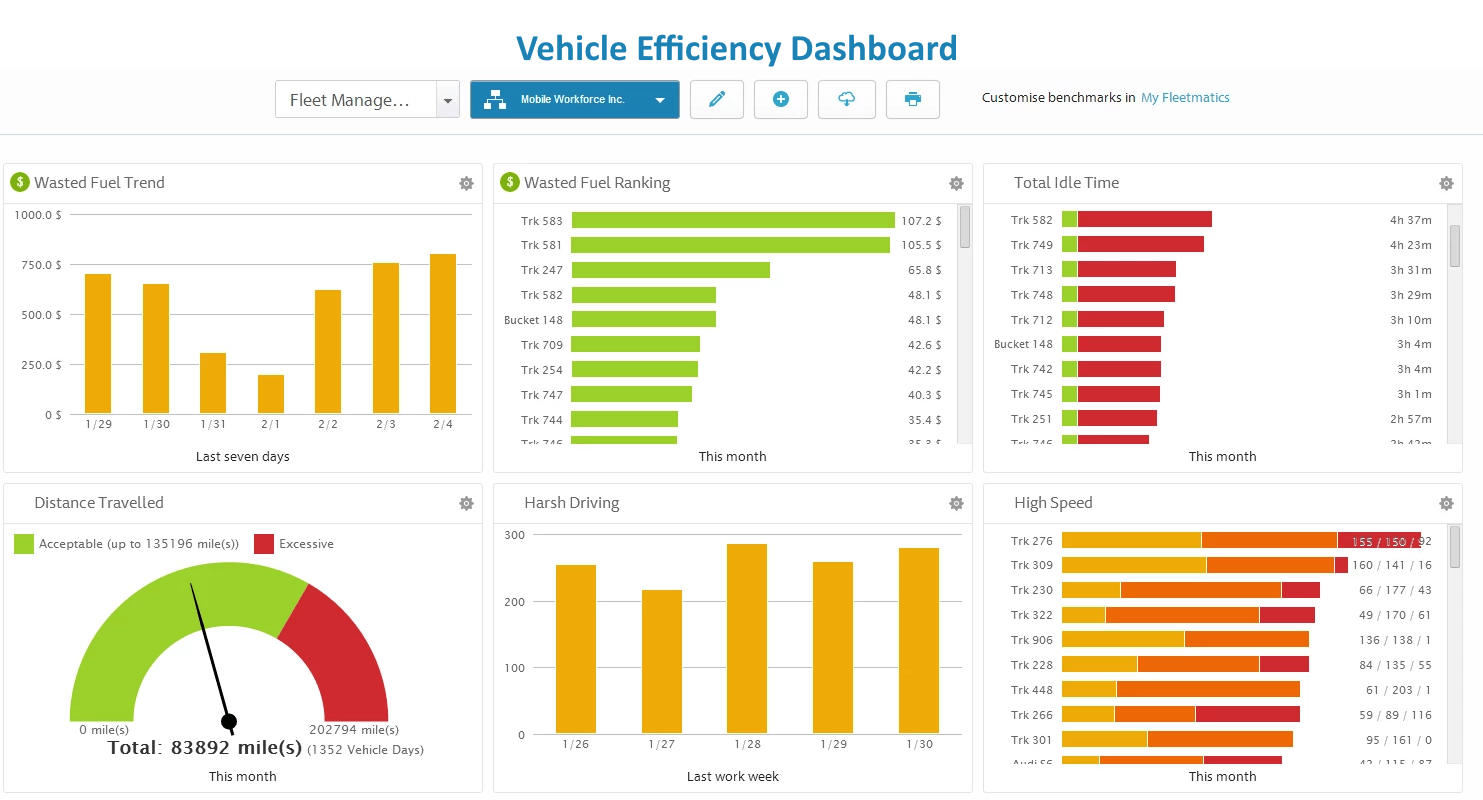
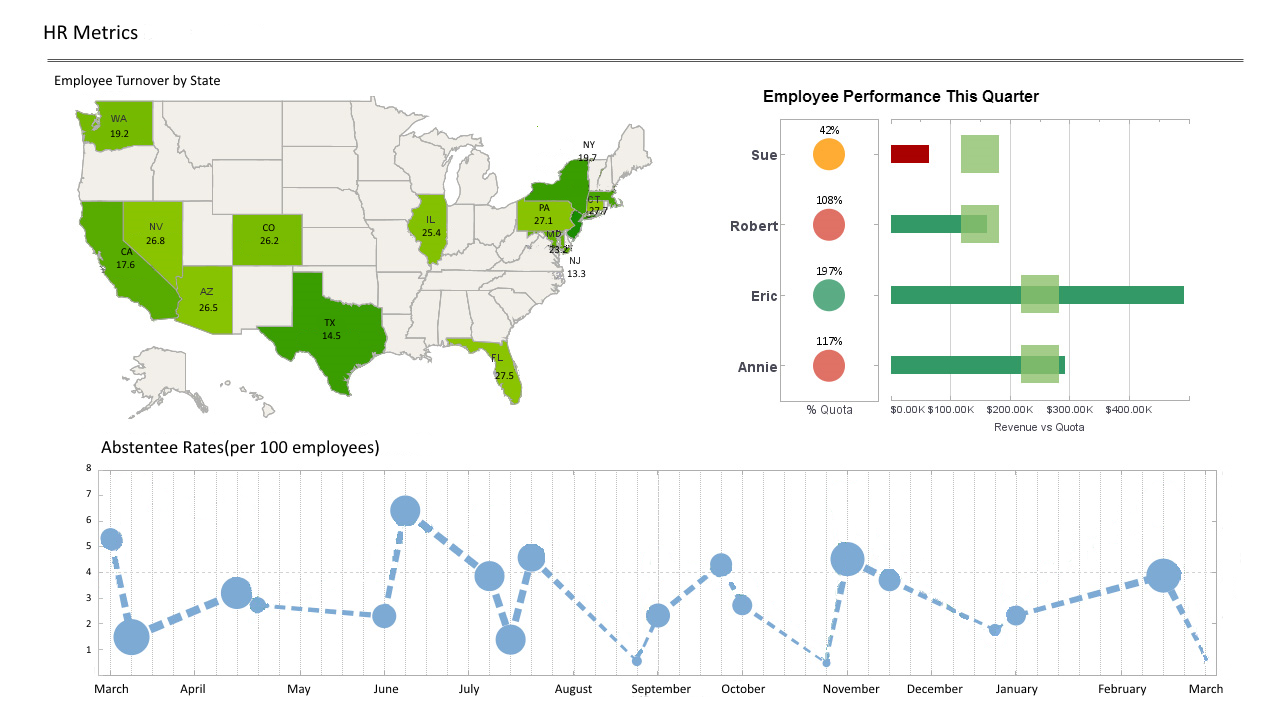
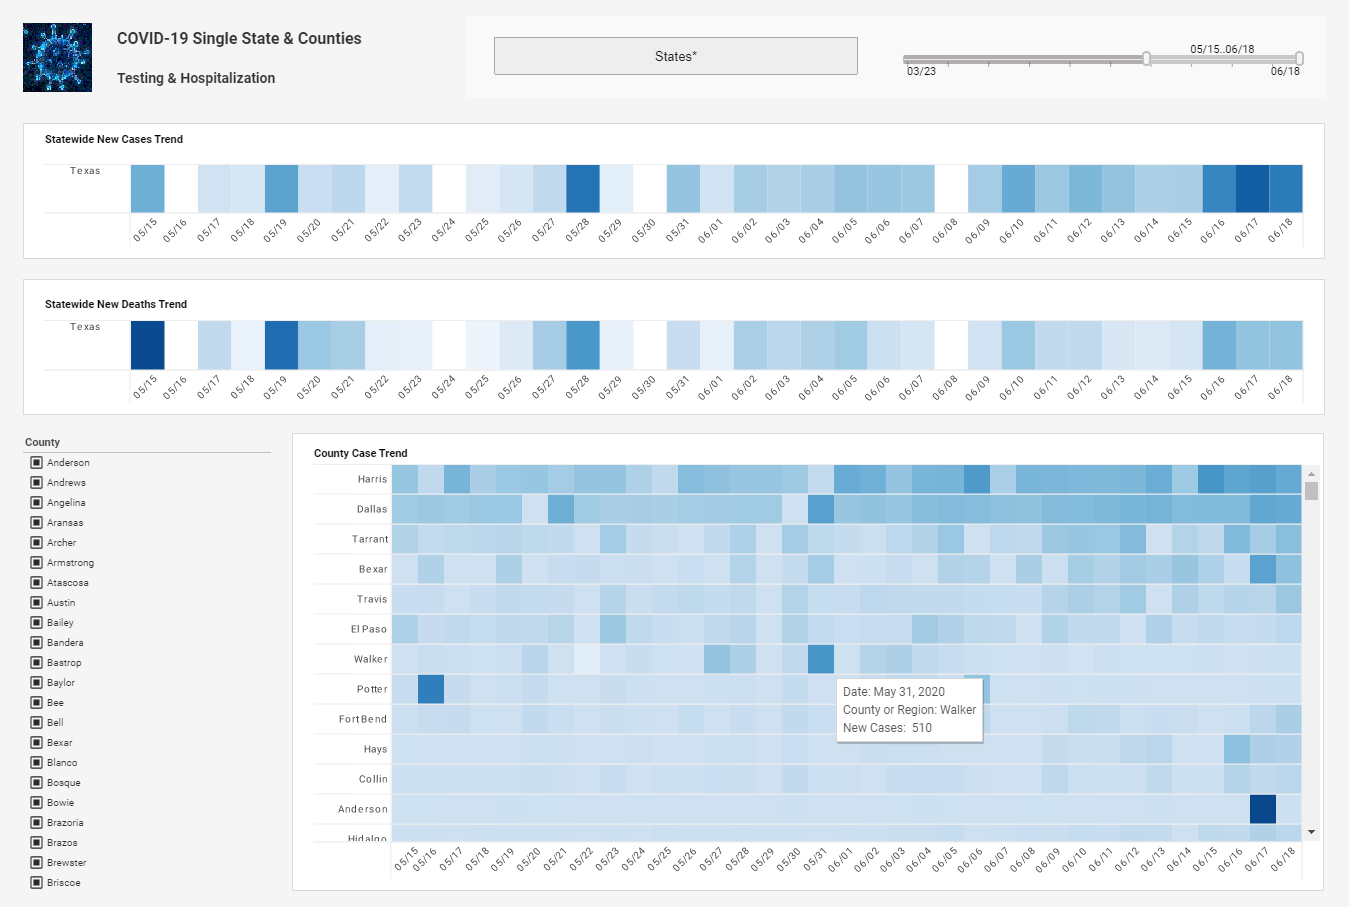
Data analysis is meaningless if the results are not communicated to the decision-makers within an organization thereby inhibiting business growth. For this reason, enterprises invest in tools that communicate analytics results through visualization protocols (Shalin 59). Data visualization enables the decision-makers of an organization to understand concepts that would otherwise be difficult to comprehend. In addition, through data visualization, decision-makers are able to identify patterns and outliers which inform the trajectory that a venture is taking. Without data visualization, organizations would not be in a position to predict market behavior. Ergo, data visualization is another important feature of analytics software. Examples of such tools include Tableau, Power BI, and Qlik Sense among several others. Analytics software with data visualization features prevents the generation of various data visuals that impede the time taken to make an organizational decision. Data visualization, as a feature of analytics software, is a catalyst for business growth.

Results Embeddability

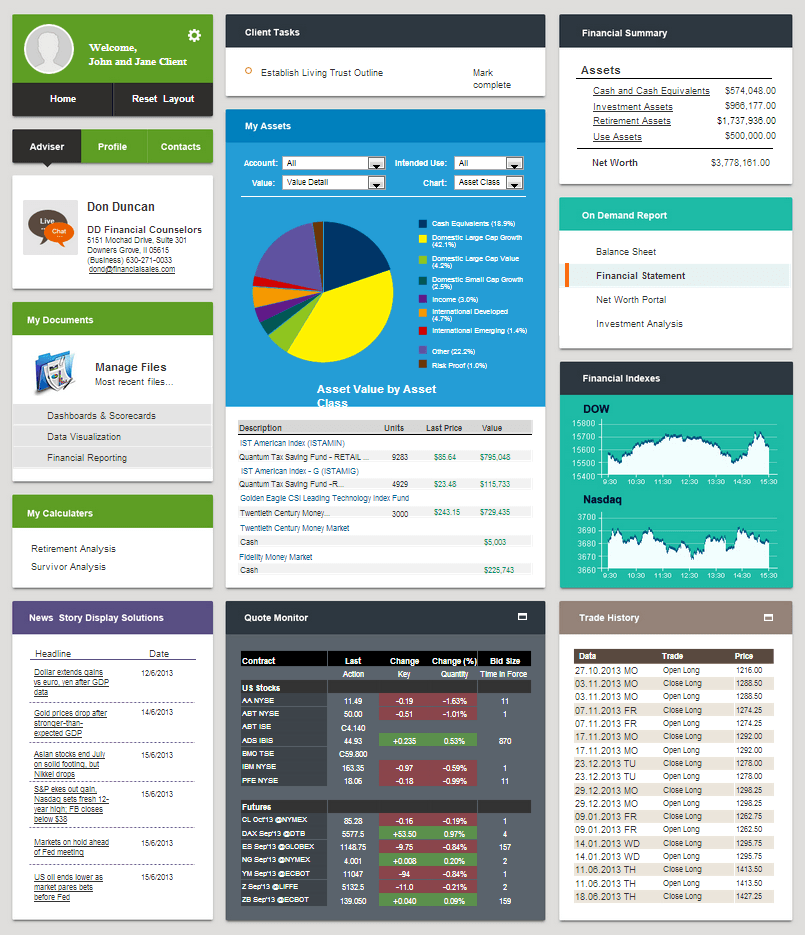
Decision-makers in an organization are constantly using multiple applications at a go and require data that enables them to make decisions without interrupting their tasks. Therefore, it is crucial that analytics results are integrated within the instantaneous decision-making schedules of an enterprise (Svolba 139). Analytics software with results embeddability features boost the productivity of an enterprise by reducing the time taken to source insights from different platforms once the analysis has taken place. Sisense is an example of analytics software with such a feature, which provides Business Intelligence (BI) solutions that rely on cloud computing to provide real-time up-to-date insights.


Apart from speeding up the decision-making process in an organization, analytics software that exhibits result embeddability is known to enhance consumer satisfaction. The embedded results provide consumers with real-time actionable insights necessary for the optimization of the various personal life issues such as financial health which require instantaneous decision-making.

Read why choosing InetSoft's cloud-flexible BI provides advantages over other BI options.

Communal Networking

The work environment is a community with individuals of diverse viewpoints. During data, analysis workers prefer to contribute their opinions about any real-time insights which may have been generated. In addition, decision-makers would like feedback about the decision taken (Information Resources Management Association 1175). In this regard, analytics software shall have features that facilitate such instances of communal networking. Tableau and Zoom are two examples of analytics software with such features. Communal networking on Tableau provides other users of the software with a platform to compare notes on various issues.

For instance, a Tableau user interested in learning how to use the tool better can pose a question to the software's community networking platform where real-time insights are shared. In addition, analytics software with communal networking features provides decision-makers with an opportunity to consult remotely on matters which require a multilateral agreement.

Unlimited Data Archival

A data repository is an archive where various data sets are stored and can be extracted at any time for analytics and reporting purposes. The major examples of data repositories include data lakes, data cubes, meta-data repositories, data marts, and data warehouses (Shalin 100). With a data repository, decision-makers in an organization are provided with multiple insights whence conclusive decisions are made. In addition, the compartmentalization which characterizes a data repository enables decision-makers to track analytics errors with relative ease. Therefore, analytics software shall have features that facilitate unlimited data archival. Such a feature is particularly useful in analytics software responsible for making predictions of future events such as fraud detection or consumer behavior. SAS Forecasting is one such predictive analytics software that requires a plethora of data for making forecasts and for which unlimited data archival is considered an asset.


Conclusion

The numerous advancements in information communication technology (ICT) imply that large volumes of data shall continue to be generated. Analytics software simplifies the process of making sense of big data for enterprise purposes. However, these analytics tools require a variety of features to enhance their role in the monetization of big data. From the 14 features listed, it is evident that humans are gradually being replaced by machines as far as data science, and by extension data analysis, are concerned. The contributions being made to ICT through artificial intelligence and machine learning indicate that analytics software share has many more features with the sole purpose of easing the business of data science.

Read how InetSoft was rated #1 for user adoption in G2 Crowd's user survey-based index.

Works Cited

"Cloud Flexible Analytics, Dashboards, & Reporting." InetSoft, n.d. Web. 2022. Information Resources Management Association. Research Anthology on Big Data Analytics, Architectures and Applications, IGI Global, 2021. https://books.google.co.ke/books?id=UdNJEAAAQBAJ&dq=analytics+software+features&source=gbs_navlinks_s

Shalin, Hai-Jew. Online Survey Design and Data Analytics: Emerging Research and Opportunities, IGI Global, 2019. https://books.google.com/books/about/Online_Survey_Design_and_Data_Analytics.html?id=tr49wQEACAAJ

Svolba, Gerhard. Data Quality for Analytics using SAS, SAS Institute, 2012. https://books.google.co.ke/books?id=Y3IDu0_U3qQC&dq=analytics+software+features&source=gbs_navlinks_s