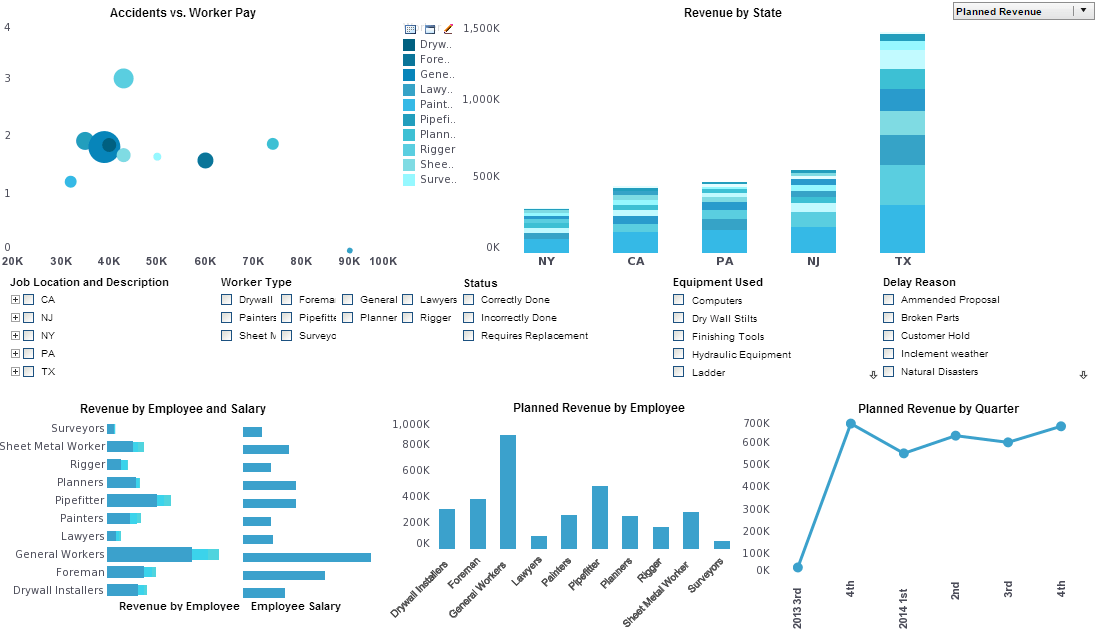
Visualization Technology Demonstration
This is the continuation of the transcript of a product demonstration of InetSoft's BI software for dashboards, reporting and mashups. The presenter is Mary Vitale, Product Manager.
Question: This kind of visualization technology is a lot like Tableau, isn’t it?
Mary Vitale (MV): Well, we definitely read the same books. Essentially, the charting and visualization concepts are all based on the same data visualization work. Continuing the demo, notice how any of the customizations of the chart or the filtering can be saved as a bookmark. This only saves those customizations and settings, not the data. So whenever I open a bookmark, I am getting fresh data.
Now I am just going to run through a few little example bookmarks that have already been saved here. Here are some flexible pie charts that also use the radius in addition to the angle. Here is a bubble chart with a correlation line charted in it. This is showing the percentage of people with a bachelor’s degree versus the median household income, so it shows that the more education you have the more money you make, in general.
And then something interesting actually I found is that there is a difference by region here. Look at the South region. The bubbles tend toward the lower left of the plot except for Virginia and Maryland, which are notable exceptions up here. And then the last example here, a stacked bar chart, and we are also using the vertical dimension which is typically ignored. These are just some examples of what can be done with the chart, we will see some more later.
Now let’s look at a couple of quick examples that are on the publishing-oriented side, also known as traditional business reporting. I will just run through these very quickly, you know mixing and matching charts, pivot tables and some more static content. This is a master detail oriented report. You create a few components and then iterate over those components for multiple states in this case or multiple values.
Here is another geographic component. Instead of coloring the entire boundary in a shape such as a state, which would artificially inflate Montana’s value, we are actually using a little bubble in this case. So we see that, okay, Montana is actually a small bubble in comparison to New Jersey which is otherwise much smaller geographic area.This next example you may not even think of this as being doable with a reporting tool, but it just shows some of our flexibility. We’re generating mailing labels and even encoding the zip code here as a barcode. And here is a more traditional table based report with some drill down capabilities and some highlighting. It's more old school.
And then here is a more sophisticated table-based report that is using a really complex layout. It's like multiple cross tabs, all stuck together, really utilizing the space well. And then this last little template here, not only is the chart engine pretty flexible in terms of lines, points, and bars, but it also supports scripting just like everything else in the dashboards and reports. You can use scripting for annotations here highlighting certain important time periods in the history of the country.
Or you can use a custom chart style, such as making a heat map here. So those are the finished products that I wanted to run through very quickly, I hope not too quickly. I do want to touch a little bit on the self-service BI capabilities, so I am going to open up the Visual Composer. So we are still in the Web browser here. Before I jump into this, do you have any questions on what you have seen so far?
Can I Control What Data Filtering Capabalities Different Role Types of End Users Can Expose?
Yes, you have role-based access control (RBAC) capabilities that enable administrators to control what data filtering capabilities different role types of end users can expose. RBAC allows organizations to define roles, assign permissions to those roles, and control access to data and functionality based on users' roles within the system.
With InetSoft's RBAC features, administrators can customize the data filtering capabilities available to different role types of end users in several ways:
-
Role Definition: Administrators can define different roles within the system based on users' job functions, responsibilities, or organizational hierarchy. For example, roles could be defined for executives, managers, analysts, and general users.
-
Permission Assignment: Administrators can assign specific permissions to each role, controlling what actions users with each role can perform within the system. This includes permissions related to data access, filtering, manipulation, and visualization.
-
Data Access Control: InetSoft allows administrators to define access controls at the data level, specifying which datasets or data sources each role type can access. This ensures that users only have access to the data relevant to their roles and responsibilities.
-
Filtering Capabilities: Administrators can customize the data filtering capabilities available to different role types within InetSoft's reporting and dashboarding tools. This includes controlling which filtering options are visible to users, such as date range filters, category filters, and custom filters.
-
Customization and Configuration: InetSoft offers customization options within its platform, allowing administrators to tailor the user interface and functionality to meet the specific needs of different user roles. This pertains toconfiguring dashboards, reports, and data visualizations to align with each role's requirements.
-
Security Policies: InetSoft's RBAC capabilities also includes features for enforcing security policies, such as password requirements, session management, and data encryption. These security measures help protect sensitive data and ensure compliance with regulatory requirements.


