InetSoft's Cloud-Flexible BI Dashboard Software
Are you researching BI dashboard solutions for your organization's internal use or to embed in a commercial application?
Deploy a small-footprint, easy-to-use web-based dashboard application nearest your primary data sources whether they are in a private or public cloud.
As an innovator in reporting software since 1996, InetSoft has pioneered the evolution from static reporting towards interactive visualization of data via dashboards.
InetSoft's award-winning software has been deployed at thousands of organizations worldwide and integrated into dozens of other application providers' solutions serving vertical and horizontal markets of their own.
Try a free evaluation copy of StyleBI, InetSoft's all-inclusive business intelligence software platform that includes the reporting application, Style Report Enterprise, and the dashboard application, Style Scope.
| #1 Ranking: Read how InetSoft was rated #1 for user adoption in G2's user survey-based index | Read More |
How to Boost BI Dashboard Performance
The best method for boosting Dashboard performance is to create a materialized view. A materialized view is a caching strategy that pre-aggregates and stores the data required by a Dashboard so that the Dashboard can respond more quickly at runtime. When a materialized view exists for a Dashboard, the server attempts to query the cached materialized view rather than querying the database. This can significantly reduce the run time for certain queries, which increases Dashboard responsiveness.
Note: Only users who have administrator privileges can change server settings.
The following sections provide a quick description of how to create and manage materialized views. For complete information, see Materialized Views in Advanced Topics.
Create a Materialized View or Data Cache
To create the materialized view for a Dashboard, follow the steps below:
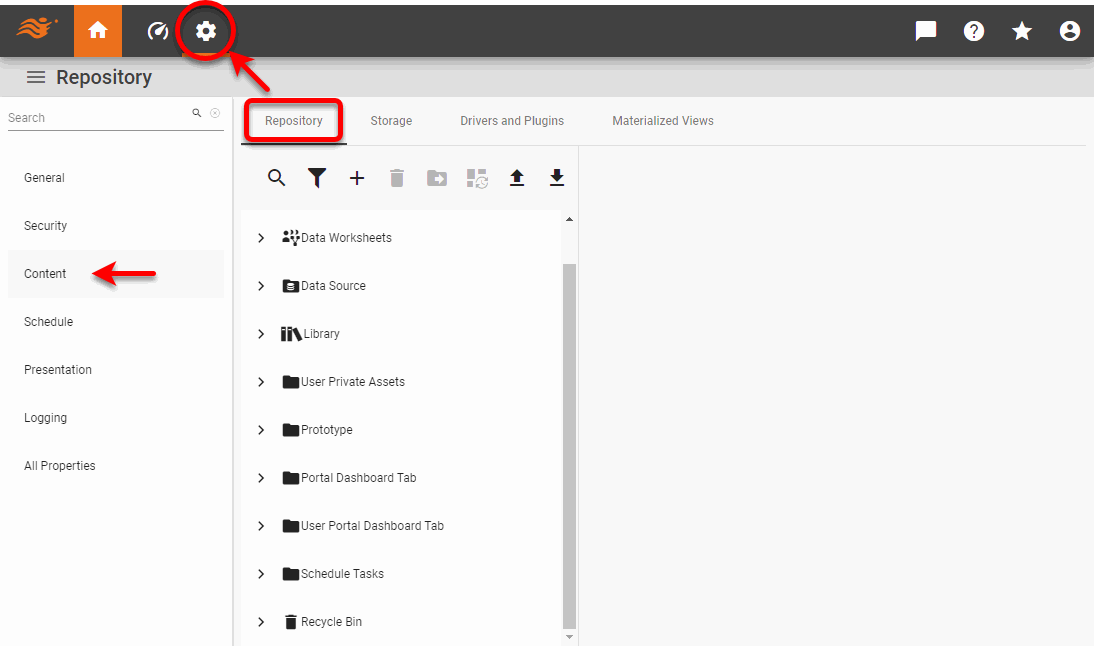
1. Press the 'Settings' button at the top of Enterprise Manager.
2. Select the Content page in the left panel, and select the Repository tab.
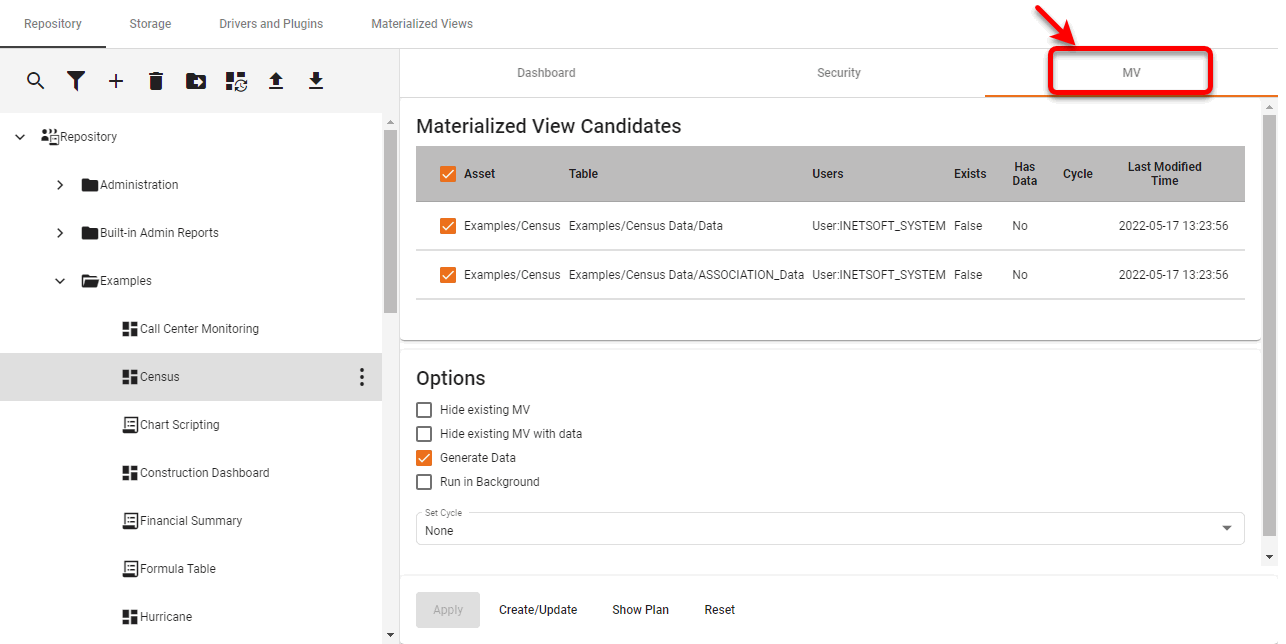
3. Expand the 'Repository' node on the tree, and click to select the Dashboard that you want to materialize. Ctrl-click to select multiple Dashboards.
4. If you selected a single Dashboard, select the MV tab.
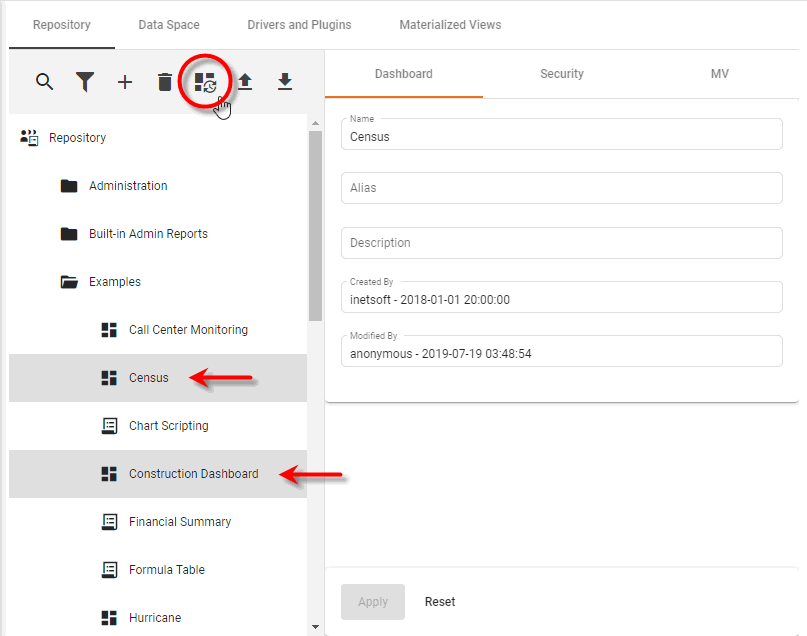
If you selected one or more Dashboards, press the 'Materialize' button above the tree. For multi-tenant implementations utilizing the multi-connection feature, materialized views are created based on user/group connection assignments. (See the DesktopApp documentation for more details on VPMs, data models, and data connections.) For this reason, if you set a Dashboard's permissions by role, you should also add individual permissions for users or groups that have particular connections. This will enable the materialized views to be generated from the appropriate connections.
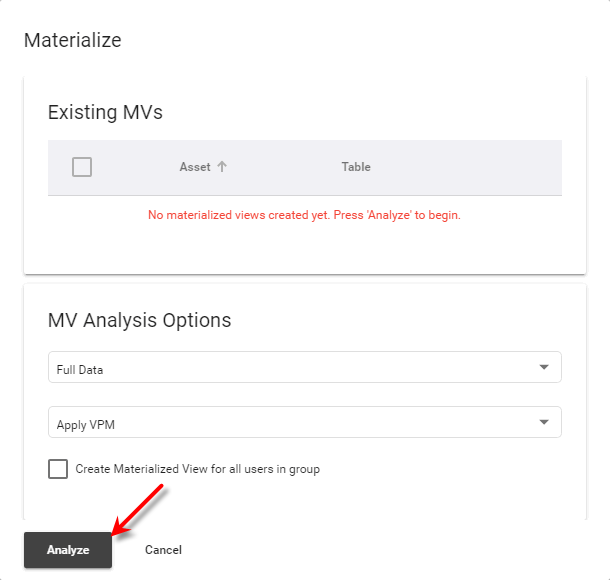
5. Press the 'Analyze' button.
6. This opens the 'Materialized View Candidates' page containing a list of assets that can be materialized.
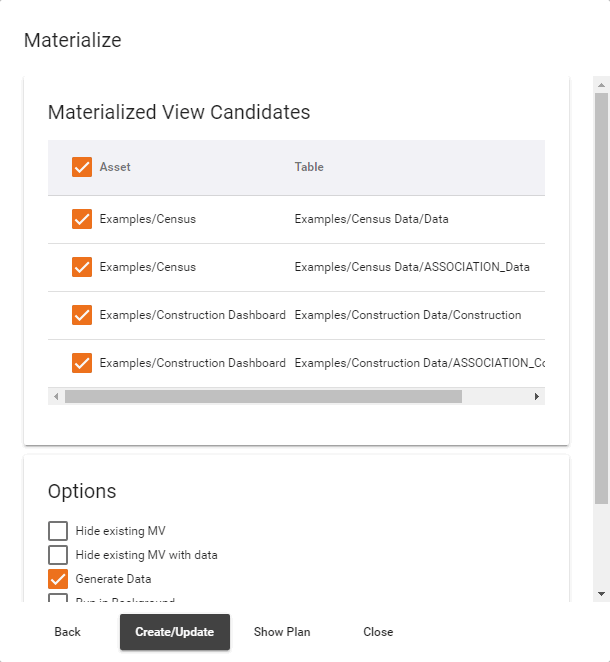
7. Check the box next to the assets for which you want to create a materialized view.
8. In the 'Select Cycle' column of the table, choose the cycle on which the materialized view should be regenerated.
9. Press the 'Create/Update' button. If you select the 'Generate Data' option, this will immediately start the generation process and notify you upon completion.
If you select the 'Run in Background' option, the materialized view will be scheduled to begin generation. You can check the status of the task under the Schedule page. (See Monitor a Scheduled Task.)
10. Press 'Apply'.
To manage existing materialized views, see Managing Materialized Views.
 |
View live interactive examples in InetSoft's dashboard and visualization gallery. |
More Articles Related to Boosting BI Dashboard Performance
Capabilities of InetSoft's Markets Dashboards - Monitor, explore, and analyze by filtering and sorting desired information Easy to use, modify, and create charts and visuals Leverage user-driven data mashup Upload and sift through multi-dimensional data to spot trends and aberrations Slice and dice data with simple point-and-click method Share visual analysis with others...
Cloud-flexible Dashboard Analytics Provider - Are you looking for a good dashboard analytics provider? Since 1996 InetSoft has been making BI software that is easy to deploy and easy to use. Build self-service oriented dashboards and visual analyses quickly. InetSoft's data mashup engine solves the data access and transformation challenges that other tools cannot. Get cloud-flexibility to run your dashboard analytics wherever you want. No dedicated BI developer required. View a 2-minute demo and read customer reviews...
Create Performance Measurement Dashboards - From conversion and turnover rates, customer profitability or financial metrics including revenue per employee and forecast accuracy of budget, companies constantly have to measure their performance on a daily, monthly, quarterly and even yearly basis between departments through various data visualizations. However, it can become difficult for organizations to create performance measurement dashboards or key performance indicators, KPI's, without a proper business intelligence program that can meet all their needs...
Designed with Accessibility in Mind - InetSoft's StyleBI software offers an easy-to-deploy, and even easier-to-use. Designed with accessibility in mind, businesses can easily adopt this solution. This sample dashboard enables the production manager to track the following KPIs: Number of goods being produced without error...
Easy Performance Tracking Dashboard Application - Looking for a performance dashboard solution for tracking KPIs and managing performance? Since 1996 InetSoft has been making dashboard software that is easy to deploy and easy to use. Its unique data mashup capabilities enable unified views of corporate performance and maximum self-service. InetSoft's dashboard application is easy enough to be: Deployed in just weeks Learned by end users with minimal training Used by any executive without the aid of IT...
Good Linux Dashboard Solution - Are you looking for the best Linux dashboard solution? InetSoft's pioneering dashboard reporting application can be hosted on any Linux server and produces great-looking web-based dashboards with an easy-to-use drag-and-drop designer. Get cloud-flexibility for your deployment. Minimize costs with a small-footprint solution. Maximize self-service for all types of users. No dedicated BI developer required. View a demo and try interactive examples...
 |
Read how InetSoft saves money and resources with deployment flexibility. |
Highlighting Specific Performance Metrics - You can highlight chart elements based on the values that they contain. To add highlights to a chart, follow these steps: 1. Right-click on a data group in the chart, and select 'Highlight' from the context menu. This opens the 'Highlight' dialog box. 2. In the 'Highlight' dialog box, define the desired highlight. In this example, you will create a chart to display 'Quantity Purchased' vs. 'State', and use highlighting to draw attention to values that exceed 5000 or fall below 1000. Follow the steps below: 1. Create a new Viewsheet based on the sample 'Analysis' Worksheet...
How Do You Measure Retail Performance? - The main objective of retailers is to achieve continuous profitability and accelerated growth of revenue. Made with Style Scope by InetSoft, this retail dashboard clearly indicates the sales patterns that would help retail managers identify key factors that affect profitability and improve sales performance. InetSoft's dashboard analyzes retail performance with a table that contains expected goals, actual credit, and their difference and percentage of accomplishment based on monthly and annual periods...
How to Create an Intranet Dashboard - Creating an intranet dashboard with InetSoft is extremely simple, and can be achieved by ordinary business users without any special programming or IT support. The three basic steps are to connect to your data sources, add components to your dashboard, and then use the dashboard anytime, anywhere. The following section will walk through these easy steps...
How Many Pillars of Data Analytics Are There? - Advanced data analytics comprises three pillars namely speed, agility, and performance which are important to utilize the full potential from it. These pillars strengthen the analytics strategies themselves and improve your business multiple folds. The three pillars of data analytics are: Speed Agility Performance...
Looking for Quick Dashboard Software - Looking for quick dashboard software? InetSoft dashboard software is quicker to install and develop with than the big BI companies' solutions. Visit the Style Scope product page to learn more, see examples, view a demo, and read customer reviews. Below are articles, documentation, and resources related to InetSoft's dashboard software: KPI Scorecards - KPI Scorecards are a business planning tool that allow users to track performance, available in InetSoft's comprehensive real-time analytical reporting and dashboard software...
 |
Learn about the top 10 features of embedded business intelligence. |
Online Dashboarding Options - With InetSoft's web-based server, you have the unique ability to choose where the data will be stored, without taking up massive amounts of storage on your personal computer. Dashboards can be accessed through a web browser, whether installed on your machine, on a remote server miles away or at a server in the company's local intranet. InetSoft's online reporting system can be installed and ran in the cloud, on a remote server provided by Amazon web services or any other provider. Connections to a company's local data set can be set up so the software in the cloud pulls in data from any number of sources, no matter the location, meaning that data can be seamlessly accessed and updated in real-time at any time from any location...
Performance Management through Visualizations - Dashboards are well-defined methods of monitoring, measuring, and managing performance by tracking metrics. InetSoft dashboards offer users the advantage of actionable business intelligence. InetSoft customers can easily monitor, explore, and analyze their data through the user friendly GUI. These dashboards are fully user-driven, with a heavy emphasis on analytic functionality...
Purpose of a Dashboard in the Trucking Industry - The purpose of a dashboard in the trucking industry is to provide real-time results and showcase logistics performance. These real-time results become the key performance indicators (KPIs), which helps you streamline the operations, especially logistics and travel based plans. As a result, you get the chance to simplify processes and make them more manageable. To make operations more streamlined and effective, trucking companies prefer to reach out to a well-recognized software development company for creating internal dashboards. These dashboards help them to manage their operations effectively...
Real Time Service Performance Monitoring - Check out these real time performance monitoring dashboard examples to explore InetSoft's latest, powerful, BI and dashboard building software. This dashboard refreshes every 5 seconds, feeding the user a constant stream of live data. This is the essence of real time, and this aggressive and powerful BI strategy is extremely useful for helpline, auto dispatch, customer service centers and more...
Read what InetSoft customers and partners have said about their selection of Style Scope for their solution for dashboard reporting. |
Searching For Performance Dashboard Examples? - A performance dashboard is a business management tool that will allow a business to keep track of all aspects of their daily activity. Below are examples of performance dashboards built with InetSoft's easy-to-use dashboard software. For example, the sales performance dashboard is able to track your sales on the east coast and compare them with your sales on the west coast. When one of those sales unexpectedly rises or falls, you are able to investigate the reasons behind this and make the necessary changes to keep your business profitable...
Solution for Student Performance Dashboard - The student performance dashboard portrayed below is an example of the intuitive and powerful functionalities that InetSoft's user-friendly analytical dashboards provide organizations across all ranges. A leader in dashboard, reporting, and data mashup solutions, InetSoft offers a solution that is perfect for organizations in need of an easy-to-use, yet more-than-capable software that enhances business operations...
This Year's Best Performance Dashboards - A performance dashboard is to a business what a windshield is to a driver: How would we know where we are, where we are going, and how to get there without one? At InetSoft, we understand that a good performance dashboard is the GPS for a healthy enterprise. Performance dashboards allow businesses to view key metrics. They give decision makers the power to efficiently view and execute strategies, processes, and objectives while also serving as a measurement for business activities...
Three Database Dashboard Examples - Dashboards offer companies various ways of representing their data. From sales projections, to employee statistics, and even inventory stock, database dashboards are able to easily represent all of the numerical data that your company can hold, into a visually appealing dashboard...
Top Inventory KPI - A warehouse is for stocking products which are known as inventory. The inventory KPI deals with how much you have stocked and how much is being dispatched. So, the important KPIs in inventory are: Inventory Accuracy - The products present in the warehouse must match the products tracked by the inventory tracking system. If there is a mismatch, it means that there is a miscalculation, theft, damage, or any other fault from the supplier. So, this Inventory accuracy helps to find out the difference between the physical stock and the tracked stock...
 |
Learn the advantages of InetSoft's small footprint BI platform. |
Two Top Management Dashboard Examples - The best way to keep your finger on the pulse of your enterprise is with business intelligence dashboards. Top management face the challenge of making sure that day-to-day business activities are aligned with the company's long-term goals. One way to periodically and conveniently track performance is with dashboards displaying Key Performance Indicators (KPIs). In general, no software application is going to provide top management with KPI's ready-to-use, since KPI's are metrics that are often derived from formulae that are specific to an enterprise and need to be mapped into the software application...
Ways Telecoms Use Dashboards - The dashboard shows an overview of the company's KPIs, like support ticket statuses, subscription details, and customer satisfaction ratings. So, it gives the company an idea of how the users feel about their service. The rate of customer satisfaction is one of the KPIs displayed on the dashboard. This informs the manager or viewer of details such as resolved support ticker and the number of outstanding ones...
What Does a Purpose of a Patient Care Report Do? - So, to fully understand the purpose of the patient care report, let us understand the benefits of this report and improve each process in healthcare. It is commonly used by emergency medical services (EMS) providers, such as paramedics and emergency medical technicians (EMTs), to document the treatment and care given to a patient while being transported to a hospital or other medical facility. Maintaining accurate and detailed patient care documentation has various advantages...


