Looking for a Business Intelligence Software Package?
InetSoft's StyleBI is a complete business intelligence software package that includes production reporting and interactive dashboarding.
InetSoft has been providing award-winning business intelligence software since 1996. With built-in support for Spark clustering, the BI platform is robust and scalable.
Key for a successful BI strategy and to maximize adoption, the BI solution is easier to deploy and use and supports advanced data mashups for maximum self-service.


| #1 Ranking: Read how InetSoft was rated #1 for user adoption in G2's user survey-based index | Read More |
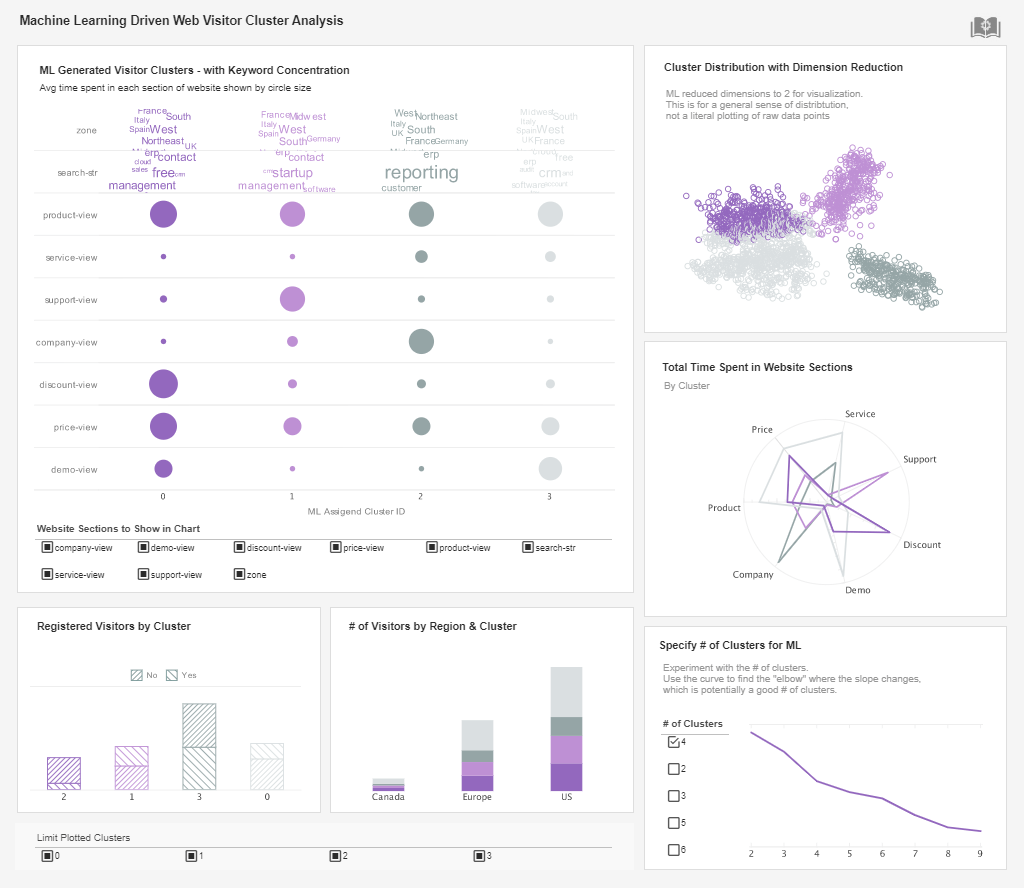
Visual Analysis & Real Time Business Intelligence
Exploring data is made fast and easy by combining InetSoft's patent pending Data Block technology with customizable visualizations.
Data Block technology enables data mashup in a Lego brick-like fashion, allowing business users to create complex queries through a simple drag-and-drop interface. IT creates perfomance-tuned and secutiry-controlled data blocks that can be transformed and assembled by business users for real-time business questions. This process enables quick and informed decision making.
Visualized analysis is constructed similarly in real-time, by dragging and dropping data items into visual elements on a spreadsheet-like canvas. The resulting visualizations reveal intrinsic relationships among the data that would otherwise not be perceptible to the human eye.
Web-Based Reporting Software
Enterprise reporting provides production reports, interactive reports and ad-hoc reports in a zero-client, Web environment and meets the needs of anyone searching for an ad hoc reporting, J2EE reporting, and Web-based reporting tool.
Style Report's 100% Java, pure Web architecture delivers an embedding and integration-ready platform. As a J2EE drop-in Web application, Style Report Enterprise Edition not only integrates with the Web user interface, it also leverages the same application server platform as that of the embedding application.
This application includes a reporting engine, API, and a what-you-see-is-what-you-get (WYSIWYG), scriptable, professional authoring environment. This tool allows IT professionals to create sophisticated production reports that can be deployed for server-based or desktop-based applications.
The small footprint Java architecture makes it an ideal solution for embedded reporting. It is based upon XML, Javascript, and other open standards technology that allows IT to fully leverage its existing abilities.

What KPIs and Metrics Does a Maker of Virtual Reality (VR) Products Track for Business Intelligence?
As VR products continue to gain traction in the market, it becomes increasingly crucial for manufacturers to leverage data-driven insights to optimize performance, enhance user experience, and drive business growth. This necessitates the identification and tracking of key performance indicators (KPIs) and metrics tailored to the unique characteristics of the VR industry.
Understanding KPIs and Metrics in the VR Industry:
Before delving into specific KPIs and metrics, it's essential to grasp their significance within the context of VR product manufacturing. KPIs and metrics serve as quantifiable measures that gauge various aspects of business performance and provide actionable insights for decision-making. In the VR industry, these indicators offer invaluable guidance for assessing product effectiveness, market penetration, customer engagement, and overall business success.
Key Performance Indicators (KPIs) for VR Product Manufacturers:
-
User Engagement Metrics:
- Session Duration: Measures the average length of time users spend in VR experiences. Longer sessions indicate higher engagement levels and satisfaction.
- Interaction Frequency: Tracks the number of user interactions within VR environments, such as clicks, gestures, or movements. Higher interaction frequencies signify deeper engagement.
- Retention Rate: Reflects the percentage of users who continue to use VR products over time. A high retention rate indicates strong user loyalty and satisfaction.
-
Content Performance Metrics:
- Content Consumption Rate: Evaluates the popularity of VR content by measuring the frequency and duration of user interactions with specific experiences or applications.
- Content Ratings and Reviews: Monitors user feedback and ratings to assess content quality, identify areas for improvement, and inform future development efforts.
- Content Conversion Rate: Tracks the percentage of users who convert from free to paid content or upgrade to premium subscriptions. A high conversion rate indicates effective monetization strategies and compelling content offerings.
-
Hardware Adoption Metrics:
- Device Sales and Market Share: Measures the volume of VR hardware units sold and the manufacturer's share of the market. Provides insights into product demand, competitive positioning, and market trends.
- Installation Base: Calculates the total number of VR devices installed and actively used by consumers. A growing installation base indicates market expansion and potential opportunities for content distribution.
- Customer Satisfaction Scores: Surveys users to assess satisfaction levels with VR hardware, including comfort, performance, and durability. Positive satisfaction scores contribute to brand loyalty and repeat purchases.
-
Financial Performance Indicators:
- Revenue Growth: Tracks the increase in revenue generated from VR hardware sales, software licensing, content subscriptions, and other monetization channels. Sustained revenue growth indicates business scalability and market acceptance.
- Profit Margin: Calculates the percentage of revenue retained as profit after deducting manufacturing costs, marketing expenses, and operational overhead. Maintaining healthy profit margins is essential for long-term sustainability and investment in innovation.
- Return on Investment (ROI): Evaluates the financial returns generated from investments in VR product development, marketing campaigns, and distribution channels. Positive ROI validates business strategies and resource allocation decisions.
Significance and Benefits of Tracking KPIs and Metrics:
The meticulous tracking of KPIs and metrics holds immense significance for VR product manufacturers, offering a plethora of benefits that drive informed decision-making and sustainable growth:
-
Performance Optimization: By monitoring user engagement metrics and content performance indicators, manufacturers can identify popular features, optimize user experiences, and prioritize development efforts to meet consumer preferences.
-
Market Insights: KPIs such as device sales, market share, and customer satisfaction scores provide valuable market insights, enabling manufacturers to understand competitive dynamics, anticipate industry trends, and capitalize on emerging opportunities.
-
Monetization Strategies: Content conversion rates, revenue growth, and profit margins help manufacturers refine monetization strategies, tailor pricing models, and maximize revenue streams while ensuring a balance between user value and profitability.
-
Strategic Planning: Data-driven KPIs empower manufacturers to formulate strategic plans, allocate resources effectively, and mitigate risks by aligning business objectives with market demand, technological advancements, and consumer behavior patterns.
-
Continuous Improvement: Regular monitoring of KPIs fosters a culture of continuous improvement, encouraging innovation, experimentation, and adaptation to evolving market conditions, customer preferences, and industry standards.
About InetSoft
Since 1996 InetSoft has been delivering easy, agile, and robust business intelligence software that makes it possible for organizations and solution providers of all sizes to deploy or embed full-featured business intelligence solutions. Application highlights include visually-compelling and interactive dashboards that ensure greater end-user adoption plus pixel-perfect report generation, scheduling, and bursting.
InetSoft's patent pending Data Block™ technology enables productive reuse of queries and a unique capability for end-user defined data mashup. This capability combined with efficient information access enabled by InetSoft's visual analysis technologies allows maximum self-service that benefits the average business user, the IT administrator, and the developer. InetSoft solutions have been deployed at over 5,000 organizations worldwide, including 25% of Fortune 500 companies, spanning all types of industries.
 |
“Flexible product with great training and support. The product has been very useful for quickly creating dashboards and data views. Support and training has always been available to us and quick to respond.
- George R, Information Technology Specialist at Sonepar USA |