Looking for a Reliable Report Delivery Platform?
Regular reports are vital for the monitoring and control of business conditions. But in many cases, the production of daily, weekly, monthly, and annual reports puts additional demands on administrators and employees. And with so much business travel and work done out in the field, report accessibly and deliverability can also be an issue. Our solution, Style Report, makes the setting up and delivery of weekly reports easy and efficient.

| #1 Ranking: Read how InetSoft was rated #1 for user adoption in G2's user survey-based index | Read More |

Report Scheduler - Run and Deliver Reports Automatically
Set up all of your reports to run automatically, without sacrificing flexibility and control
With our Report Scheduler, you can automate an unlimited number of reports, without creating additional work for IT or administrators. The Report Scheduler can be programmed to generate reports at any regular interval, whether it is a daily, weekly, or quarterly basis.
A report can also be triggered on a certain date or when a certain condition or threshold is met. The function of report delivery is also fully automated and scheduled. Reports can be automatically delivered by email or print, as well as exported into Word, Excel, PowerPoint, PDF, and other formats.
Easy to Use and Access for Maximum Convenience
Make your reports accessible in the office, at home, or in the field.
Our solution is easy to learn; only basic Excel skills are needed. Companies who use our software see the value of this when managers start creating their own ad hoc reports, without support from IT. And with our mobile capabilities, report access is no longer an issue. Style Report is a web-based solution, which can be accessed on Ipads, Iphones, laptops, and other mobile devices.
 |
View a 2-minute demonstration of InetSoft's easy, agile, and robust BI software. |
Data Mashup and Drilldown - Flexible, Interactive Reporting
Give your users the power to discover new insights into your company's data
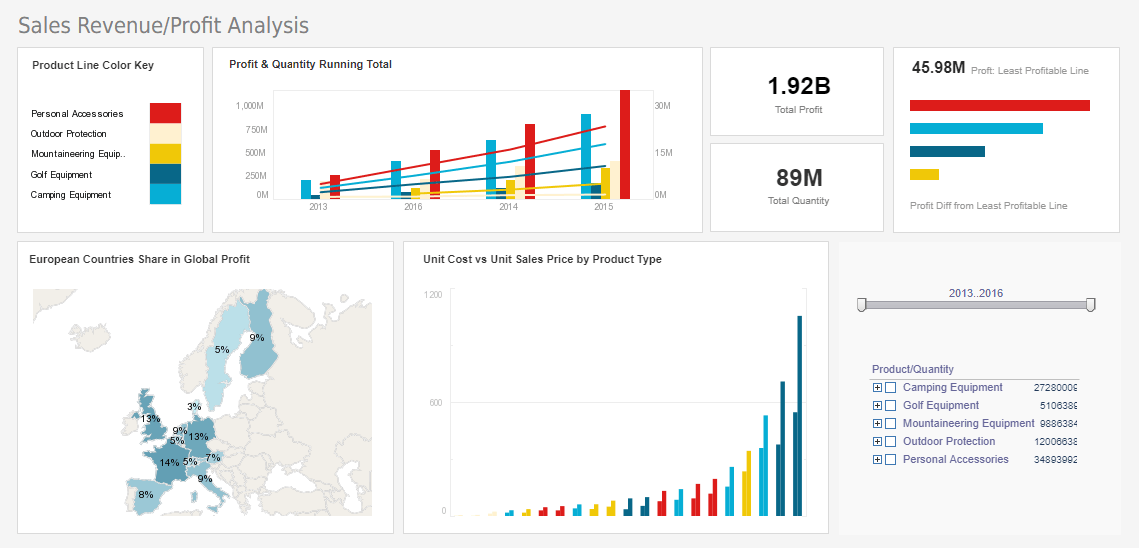
With Style Report, you won't have to run redundant reports because of limited data access. Our solution can mashup data from many diverse sources in real time, giving you maximum flexibility in report generation. Reports can also be made interactive with drilldown capability, enabling managers to find further insights in the data. Certain patterns or thresholds in the data can be set to trigger alerts, ensuring that certain conditions do not escape the reader's attention.
Eleven Delivery Options
- Web-Based Report Delivery:
- InetSoft supports web-based report delivery, allowing users to access and view reports through a web browser. This provides a convenient and accessible way to share information across an organization.
- Email Delivery:
- The ability to schedule and deliver reports via email is a common feature in BI tools. Users can set up automated schedules to send reports to specific recipients at designated times.
- Export to Different Formats:
- InetSoft offers options to export reports in various formats such as PDF, Excel, CSV, or other commonly used file formats. This flexibility enables users to save or share reports in a format that suits their needs.
- Embedding in Applications:
- For integration with other applications, InetSoft provide features for embedding reports directly into third-party applications or portals. This is useful for creating a seamless experience for users who access reports within familiar environments.
- Printable Reports:
- InetSoft supports the generation of printable reports, allowing users to produce hard copies of reports for meetings, presentations, or documentation purposes.
- FTP or File Server Delivery:
- the BI tool allow users to save reports to a file server or FTP location, providing a centralized repository for accessing and storing reports.
- Interactive Dashboards:
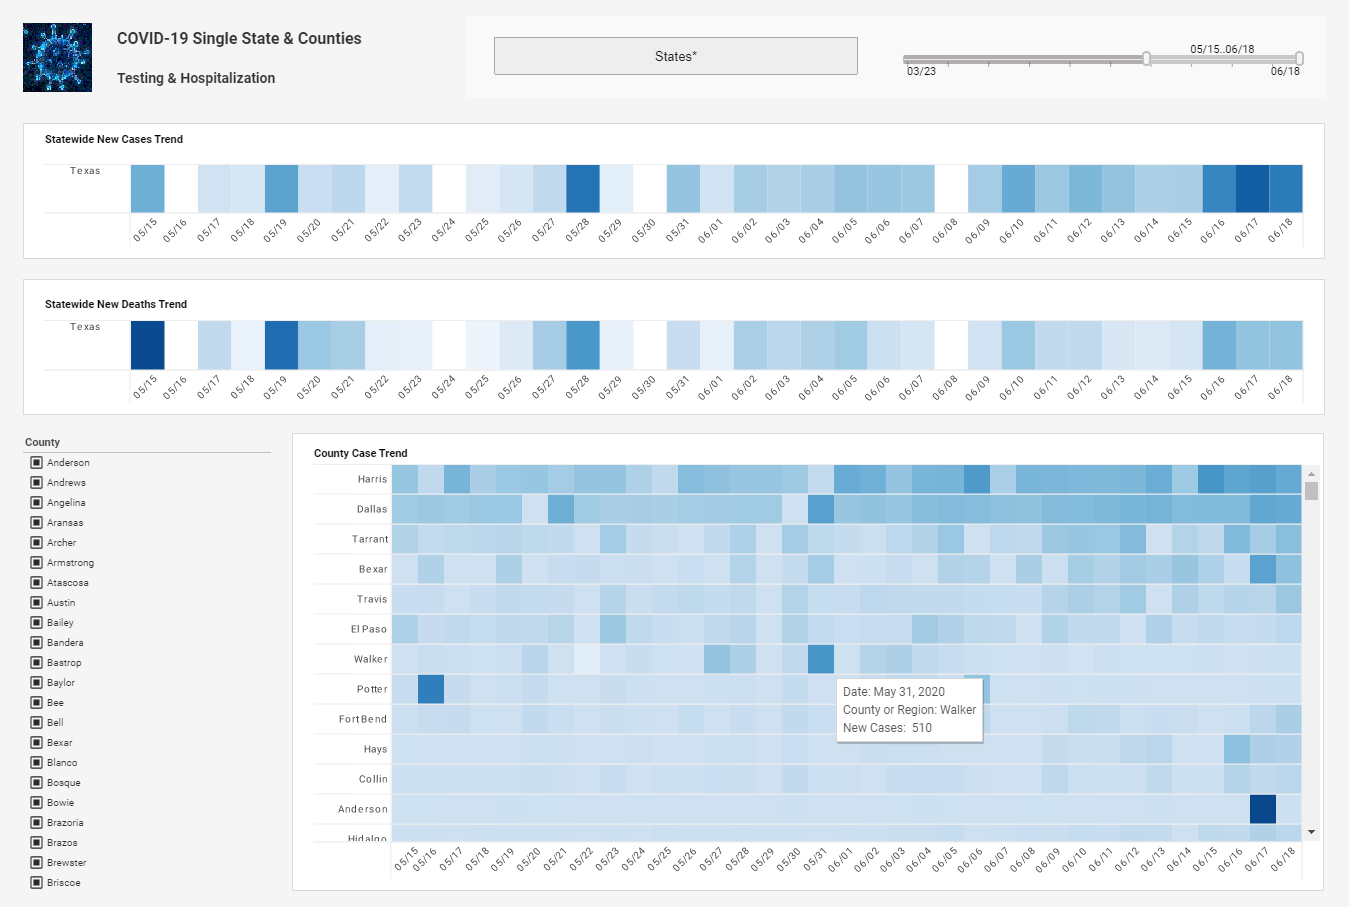
- InetSoft offers interactive dashboards that users can access to explore data and generate reports dynamically. This can be particularly useful for decision-makers who want real-time insights.
- Mobile Delivery:
- InetSoft provides options for delivering reports to mobile devices, ensuring that users can access critical information on the go.
- Role-Based Access Control:
- InetSoft offers role-based access controls, allowing administrators to define who can access specific reports. This helps in ensuring that sensitive information is shared only with authorized individuals.
- Integration with Enterprise Portals:
- Integration capabilities with enterprise portals enable users to access reports seamlessly within their existing corporate portal environments.
- API for Custom Integrations:
- InetSoft provides an API (Application Programming Interfaces) that allow organizations to create custom integrations with other systems, facilitating tailored solutions for report delivery.
About InetSoft
Since 1996 InetSoft has been delivering easy, agile, and robust business intelligence software that makes it possible for organizations and solution providers of all sizes to deploy or embed full-featured business intelligence solutions. Application highlights include visually-compelling and interactive dashboards that ensure greater end-user adoption plus pixel-perfect report generation, scheduling, and bursting.
InetSoft's patent pending Data Block™ technology enables productive reuse of queries and a unique capability for end-user defined data mashup. This capability combined with efficient information access enabled by InetSoft's visual analysis technologies allows maximum self-service that benefits the average business user, the IT administrator, and the developer. InetSoft solutions have been deployed at over 5,000 organizations worldwide, including 25% of Fortune 500 companies, spanning all types of industries.
 |
“We evaluated many reporting vendors and were most impressed at the speed with which the proof of concept could be developed. We found InetSoft to be the best option to meet our business requirements and integrate with our own technology.”
- John White, Senior Director, Information Technology at Livingston International |
More Articles Related to Report Delivery
Access for Maximum Convenience - Easy to Use and Access for Maximum Convenience Make your weekly dashboards accessible in the office, at home, or in the field. Our solution is easy to learn; only basic Excel skills are needed. Companies who use our software see the value of this when managers start creating their own ad hoc reports, without support from IT. And with...
Business Requirements For Analytics - But on the other hand, IT is tasked with controlling the application and managing risk. So, obviously, agility and flexibility doesn't really align very well with risk management. It's almost kind of one or the other. Or if you talk to any businessperson, obviously on the top of their minds and the top of their agenda is really being able to fulfill their business requirements for analytics or decisions...
Control What Is Controllable - That has worked very well because it allows people to control what is controllable and what they've got domain over while informing other people about those policies and decision as they move forward. So it actually works very well. We don't recommend starting there, but as governance matures, this model of regimes work very well...
 |
Read how InetSoft was rated as a top BI vendor in G2 Crowd's user survey-based index. |
Definition of a Cross Join - The Cross Join or Cartesian product of two tables was already mentioned earlier to help explain join theory. It is rarely used in practice because of the computational load in implementing this join, and relative lack of practical applications. There are nevertheless some special cases when such joins may be required. Creating a Join in InetSoft Creating any of these join types is extremely easy in the InetSoft Visual Composer. To create a join, select the two tables that you want to join, and press the Join button in the toolbar. Select the desired join type...
Discover New Insights - Give your user's the power to discover new insights into your company's data With Style Report, you won't have to run redundant reports because of limited data access. InetSoft's solution can mashup data from many diverse sources in real time, giving you maximum flexibility in report generation and giving recipients a high degree of self-service...
Entertainment Industry Weekly Report - Performance Metrics: Key performance indicators (KPIs) related to the project's performance, such as audience engagement (if applicable), social media buzz, or other relevant metrics. Market Research and Audience Insights: Insights into the target audience, market trends, and competitive landscape. This helps ensure that the project is aligned with audience preferences and industry trends...
Mortality Analysis Example - In this medical report example you can easily wring out a huge variety of statistics surrounding national mortality. The visuals can be displayed by age, race, gender or cause. You can filter out specific diseases within each Cause or zoom in for an intimate analysis within certain communities. Easily spot the major causes or drill down to find the way certain causes affect demographics differently...