Great Business Intelligence Examples
Are you looking for great business intelligence examples? InetSoft has published an extensive library of fully-functional examples of data discovery and interactive reporting. InetSoft is top-rated by users on G2 Crowd. Interact with examples and register for a personalized demo.
Global Shipping Dashboard Example

This supply chain analysis example gives a global view of shipped orders. This view is aided by several map charts, one of which features a zoom in on key areas. Key metrics featured are Perfect Orders, Shipping Cost by Country, Average Shelf Time by Product, Stocked vs. Made to Order, and Made to Order Planned vs Actual Time.
Energy Source and Usage Report Example

This power management dashboard is helpful in managing all aspects of a power grid.
Usage is tracked by state and power source, with outages and transformers monitored as well.
Production Times and Errors Analysis Example

This manufacturing KPI dashboard is designed to provide an overview of production times, costs, and errors, displayed with a variety of charts and text kpis. The Produce Time by Product chart compares production times for each product to set benchmarks, helping managers to assess performance at-a-glance. A radar chart displays a variety of product measures. Text KPI's in the top left corner give an at a glance picture of the factory's overall performance.
Marketing CRM Leads Report Example

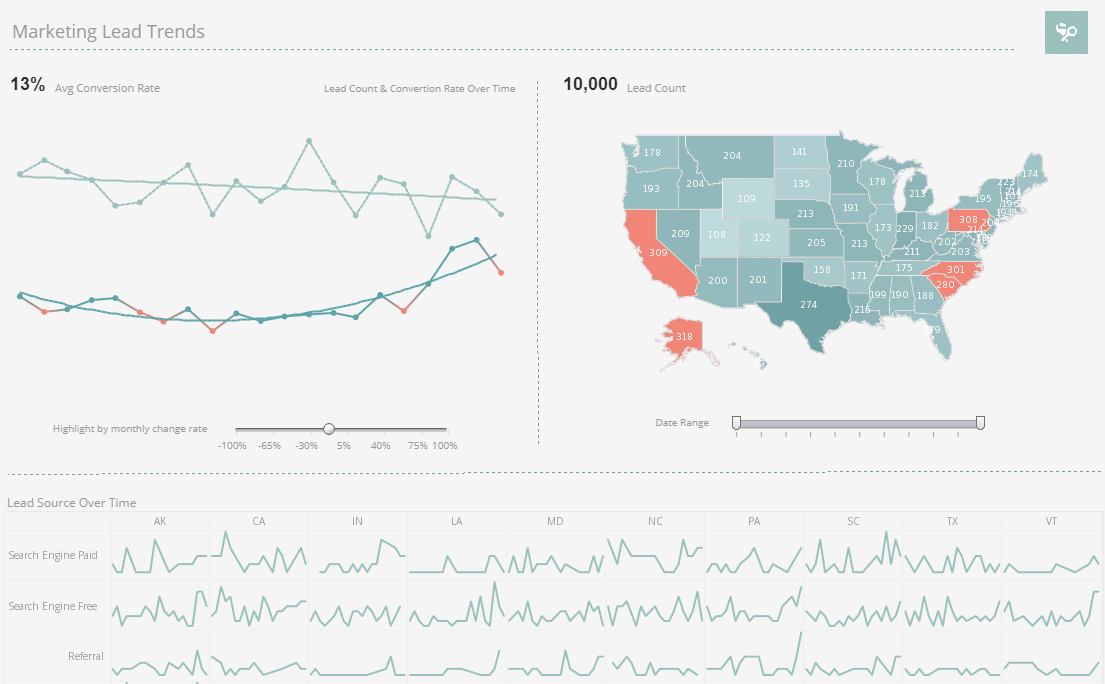
This marketing dashboard example gives marketing managers the metrics they need to monitor sales pipelines and optimize strategy. Lead count and source are tracked as well as conversion rates, with monthly change highlighted based on slider selection.
Machine Maintenance Dashboard Example

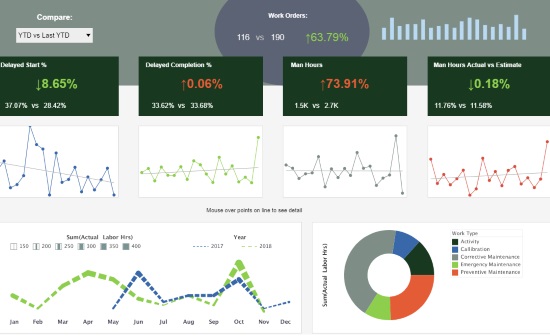
This machine operations dashboard example gives a high level view of all maintenance being performed.
Delays are tracked, enabling managers to monitor the timeliness of their workforce.
Multi-Channel Social Media Analytics Example

This social media marketing dashboard can free business users from juggling multiple social media accounts across various platforms, and allow them to monitor accounts and track engagement metrics all in one place. The dashboard consists of a combination of easy-to-understand charts such as summary charts, line charts, bar charts, and pie charts to present engagement information across multiple platforms, and uses interactive filters to simplify the process of making analysis and comparisons.
DoorDash Report Example

Combining the capabilities of data mashup with powerful visualization, the restaurant delivery platform dashboard created using Inetsoft's Style Scope caters to the requirements of food delivery app analysts who are looking to derive important insights that can help their business offer better service to their customers and generate higher revenue. The unique device adaptability feature of Inetsoft's Style Scope makes it easy to switch between multiple devices without compromising on the interactivity of the dashboard.
LEO Fatalities Analysis Example

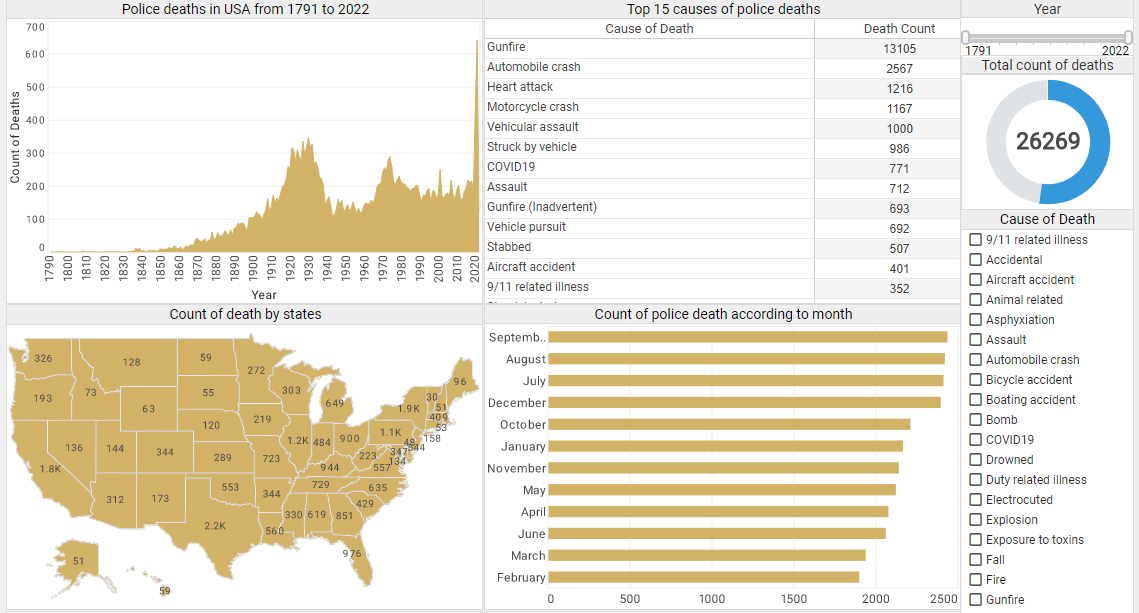
This interactive law enforcement dashboard displays police fatality data since 1791, across 17,985 police departments in the United States. The visualization's charts and tables let users comprehend these vast amounts of data at a glance in a more efficient way. The dashboard also incorporates several tables to allow users to dive deep into more details. The tables list the top 15 death causes, the top 15 types of police officers in the most danger, and the top 15 departments with the most police deaths, providing details of police deaths that are the most relevant to analyze from an abundant amount of data.
Consumer Finance Metrics Example

This credit card approval dashboard investigates several factors associated with credit card approvals, including income, debt, age, ethnicity, credit score, marriage status, and gender. It not only allows financial users to visualize the relationship between a single factor and credit card approval rates at a glance, it also helps users slice and dice relationships easily between different variables with built-in checklists and sliders. Through the intuitive charts and filter functions on this credit card approval analytics dashboard, financial professionals can be more accurate in constructing credit card customer personas, understanding how different factors interact and affect the credit card approval rate.
Register for more info and free software
About InetSoft
InetSoft is a pioneer in delivering easy, agile, and robust business intelligence software that makes it possible for organizations and solution providers of all sizes to deploy or embed full-featured business intelligence solutions. Application highlights include visually-compelling and interactive dashboards that ensure greater end-user adoption plus pixel-perfect report generation, scheduling, and bursting. InetSoft's patent pending Data Block™ technology enables productive reuse of queries and a unique capability for end-user defined data mashup.
This capability combined with efficient information access enabled by InetSoft's visual analysis technologies allows maximum self-service that benefits the average business user, the IT administrator, and the developer. InetSoft was rated #1 in Butler Analytics Business Analytics Yearbook, and InetSoft's BI solutions have been deployed at over 5,000 organizations worldwide, including 25% of Fortune 500 companies, spanning all types of industries.

