Access to Multiple Data Sources
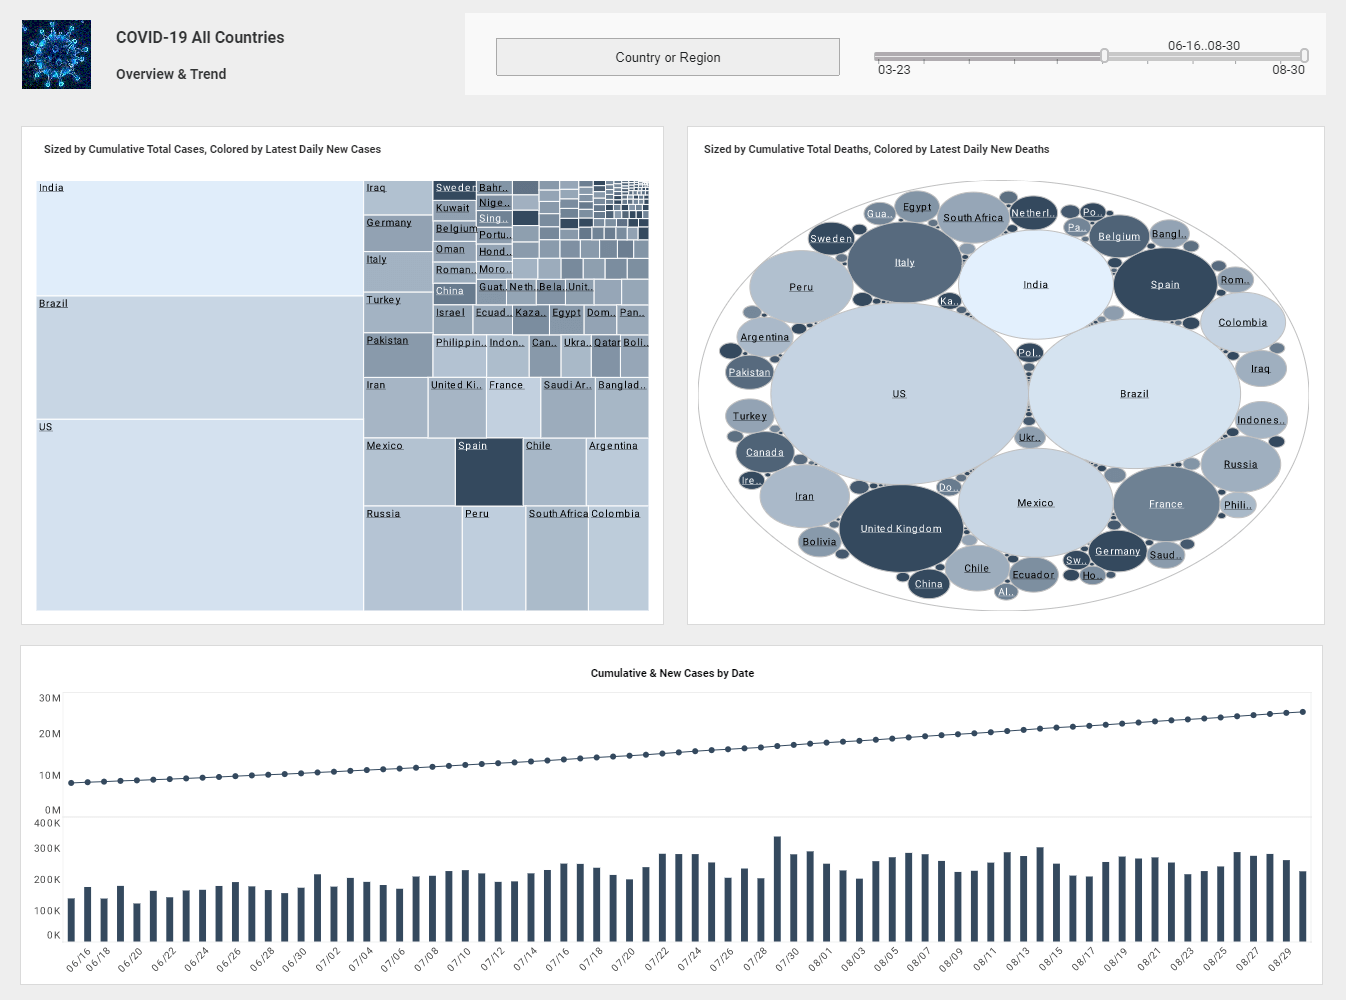
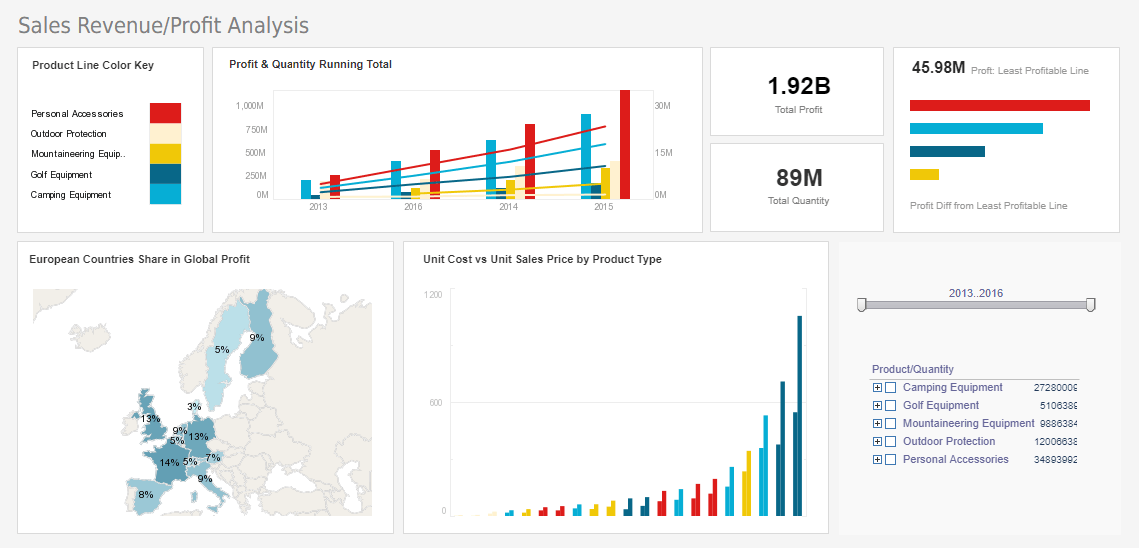
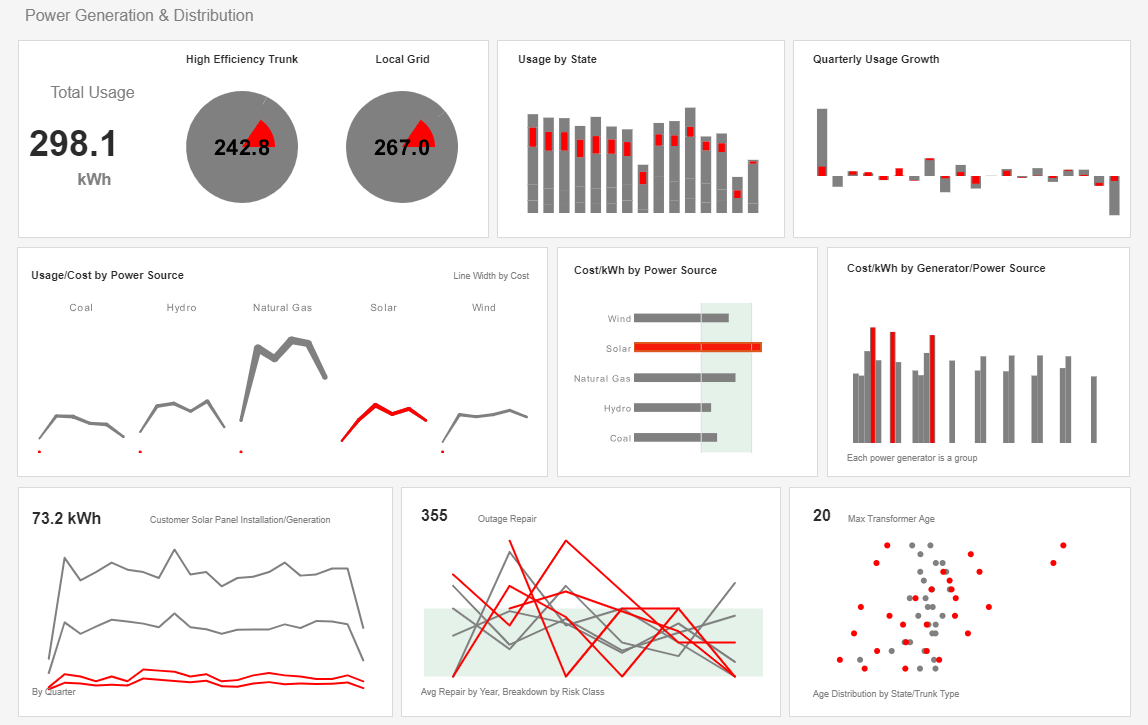
InetSoft's BI platform, StyleBI, enables users to seamlessly extract data from multiple sources, and create dashboards and automated reports that reveal advantageous insights. The robust data mashup engine can join many data sources on common dimensions so that an aggregation of sources can be analyzed and manipulated within a single view. Once IT has connected and defined data sources, everyday users can create sophisticated reports and impressive visual analytic dashboards.
InetSoft's data extraction tools are capable of simultaneously accessing and integrating information from operational databases, data warehouses, and enterprise applications such as:
- Relational databases such as Oracle, SQL Server, PostgreSQL, and MySQL via a JDBC driver
- Multidimensional databases
- Hadoop/HIVE
- XML
- SOAP
- Java beans (POJO)
- EJB beans
- Flat files (CSV)
- Microsoft Excel spreadsheets
- OLAP cubes such as Microsoft SQL Server Analysis Services, Hyperion ESSbase, Oracle OLAP, and SAP NetWeaver
- SAP Business Information Warehouse (SAP BW)
- Progress
- PeopleSoft
- JD Edwards
- salesforce.com
- Siebel CRM
- Google AdWords
- Google Analytics
- Microsoft SharePoint
- and more
| #1 Ranking: Read how InetSoft was rated #1 for user adoption in G2's user survey-based index | Read More |
Maximize Productivity with Effective Data Mashup Tools
Robust data mashups are a significant advantage offered by InetSoft's BI software. Our patent pending Data Block technology is used to combine diversified tables and fields into a single relevant data model. Data from any of the previously listed sources can be merged; data spreadsheets of your own and other partners or vendors can be integrated effortlessly without sacrificing information.
The Data Block makes it easy for IT users to create their own data mashups without a predefined data model. Since StyleBI is web-based, dashboards and reports can be accessed by anyone with a web browser, including users with mobile devices and PDA's.
Generate Dynamic Interactive Dashboards and Compelling Reports
With InetSoft's solution, you can bring your data to life with visually alluring reports and engaging dashboards. The robust functionality of StyleBI allows users to manipulate and reassemble dashboard and reports as needed, delivering pixel-perfect reports and visualizations that make for effective and informative presentations.
InetSoft's data grid cache uploads all necessary data onto a single server and stores it in a Hadoop-like architecture, so that data from an array of sources can be manipulated and explored at high speeds. Style Intelligence also includes a feature for ad-hoc reporting, enabling new reports to be created on the fly, according to informational needs.
Whether obtaining and organizing data from multiple sources, or creating sophisticated dashboards and illustrative reports, InetSoft's BI software provides an ample range of flexible functionality. Consider InetSoft's robust, agile, ease-of-use BI software for all of your information needs.
What Data Sources Would a Data Analyst at a Toy Manufacturer Mash Up?
A data analyst at a toy manufacturer would likely mash up data from various sources to gain comprehensive insights into different aspects of the business and the market. Some potential data sources that a data analyst at a toy manufacturer might mash up include:
-
Sales Data: Sales data from internal systems would provide valuable information about which toys are selling well, trends over time, and regional variations in sales. This data could include information such as product SKUs, sales quantities, revenue, and customer demographics.
-
Inventory Data: Inventory data would allow the analyst to understand stock levels, turnover rates, and potential supply chain bottlenecks. By combining sales data with inventory data, the analyst could identify which toys are in high demand and ensure that sufficient stock is available to meet customer demand.
-
Marketing and Advertising Data: Data from marketing campaigns, including advertising spend, impressions, click-through rates, and conversion rates, would help the analyst evaluate the effectiveness of different marketing channels and campaigns in driving toy sales.
-
Customer Feedback and Reviews: Customer feedback and reviews from online platforms, social media, and customer surveys could provide insights into customer preferences, satisfaction levels, and areas for product improvement. Analyzing sentiment data could help the toy manufacturer understand which toys are resonating with customers and why.
-
Competitor Data: Data on competitor products, pricing, promotions, and market share would allow the analyst to benchmark the toy manufacturer's performance against competitors and identify opportunities for differentiation and competitive advantage.
-
Market Research Data: Market research data, including industry reports, consumer surveys, and trend analyses, would provide context about broader market trends, consumer preferences, and emerging opportunities or threats in the toy industry.
-
Supply Chain Data: Supply chain data, such as supplier performance, shipping times, and logistics costs, would help the analyst optimize supply chain operations, reduce costs, and ensure timely delivery of toys to customers.
More Articles About Data Mashup
3PL Company Embeds Dashboads - "InetSoft had the right combination of price, visualization capability, and interactivity to meet our needs," explains Mike Gindlesperger, Manager of Information and Technology Services at KDL. "Some of our more hands on customers are really going to enjoy InetSoft's ad hoc editing on interactive dashboards."
Laboratory IMS Application Embeds BI - InetSoft's software will be embedded into Ventura's Laboratory IMS and Hospital IMS applications to meet Ventura's clients' business intelligence needs. LIBS BI will be used by laboratory decision makers, and HIMS BI will be used by Hospital Managers. Pre-built analytical dashboards will be used to improve the decision-making process...
Online Food Delivery Dashboard Example - KPIs are an effective way to present a consolidated view of the performance of an organization in a quantifiable format. Inetsoft's Style Scope assists the designers in making the key food delivery metrics such as revenue and average customer review available to the business users, in large, easy to read text.. The designers have chosen to highlight the metrics on the dashboard in a way that encourages the business users to keep overall performance in mind...
School Management System Embeds BI - They are very impressed with the way that our platform allows educators to interact with their student data. They have expressed that they find that this kind of productive visualization technology is not available in other educational platforms that are in use throughout the school system...


