Agile Executive Dashboard Software
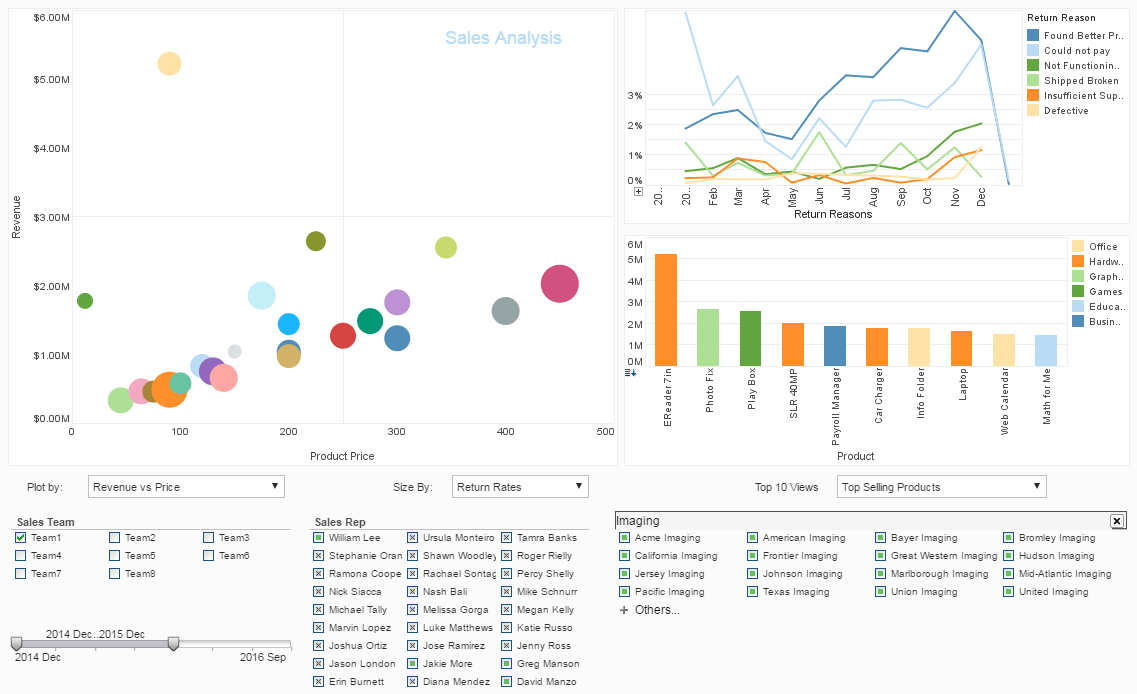
Are you looking to create an agile executive dashboard for top management? InetSoft's agile BI solution allows for the creation of visually appealing and communicative dashboards with edit functions that can be left unlocked, allowing managers to modify their dashboards in accordance with new needs that arise, and save their own personalized version.
Agile BI is often defined in two ways. The first is performing a BI implementation in an agile manner through iterations. Users may not know exactly what metrics are useful to them ahead of performing analysis, so giving them some draft versions of their reports allows them to fine-tune as they are go along.
This is effective because it's hard to understand what messages are in the data until they're noticed; only then do users realize what changes are needed. InetSoft's tool is flexible enough to be tweaked endlessly without going back to the drawing board.
The other side of agile BI is self-service BI. The Business Intelligence application, itself, is agile. The user can interact with it and change it, and even "muck around" in the data. These new Big Data capabilities can provide a great benefit to today's organizations. The larger the amount of data allowed for, the more questions can be answered definitively.
InetSoft's drag and drop viewsheets and data worksheets enable dashboards to be modified and created easily, and even facilitate the joining of data sources without any SQL needing to be written.
What KPIs and Metrics Are Found on the Executive Dashboard for the Transportation Authority?
The KPIs (Key Performance Indicators) and metrics found on the executive dashboard for a Transportation Authority typically focus on various aspects of operations, service delivery, safety, financial performance, and customer satisfaction. Here are some common KPIs and metrics you might find:
-
On-Time Performance: This metric tracks the percentage of buses, trains, or other transportation modes that arrive on schedule. It helps gauge the reliability of the transportation service.
-
Ridership Trends: Monitoring the number of passengers using the transportation services over time helps assess demand patterns and identify trends that may impact service planning and resource allocation.
-
Revenue and Farebox Recovery Ratio: This KPI measures the percentage of operating expenses covered by fare revenue. It provides insights into the financial sustainability of the transportation system.
-
Vehicle Utilization: Tracking the utilization rate of vehicles helps optimize fleet management and resource allocation. It involves monitoring factors such as vehicle occupancy rates and mileage.
-
Safety Incidents and Accidents: Monitoring the number of safety incidents, accidents, and near-misses helps ensure the safety of passengers and employees. This KPI includes metrics such as accident frequency rate and severity rate.
-
Customer Satisfaction: Conducting regular surveys or collecting feedback from passengers allows the Transportation Authority to measure customer satisfaction levels. Metrics may include overall satisfaction scores, satisfaction with cleanliness, comfort, and reliability.
-
Service Reliability: This KPI assesses the reliability of the transportation service by tracking metrics such as service interruptions, delays, and cancellations. It helps identify areas for improvement in service delivery.
-
Operational Efficiency: Metrics such as fuel consumption per vehicle mile, maintenance costs per vehicle, and labor productivity help evaluate the efficiency of operations and identify opportunities for cost savings.
-
Environmental Impact: Monitoring metrics such as carbon emissions per passenger mile or fuel efficiency helps assess the environmental sustainability of the transportation system and track progress towards sustainability goals.
-
Financial Performance: Key financial metrics include revenue, operating expenses, subsidies received, and overall profitability or financial health of the Transportation Authority.
-
Infrastructure Maintenance and Condition: Tracking metrics related to the condition of infrastructure assets such as tracks, bridges, stations, and vehicles helps prioritize maintenance and capital investment projects.
More Articles About Executive Dashboards
How to Create a Top-notch Executive Dashboard - These guidelines might help you create an executive dashboard that is suitable for your team. If you want to create a dashboard that helps you lead effectively, you must know what data to present and how to display it. You'll assist a certain audience inside your firm using the important...
The Aha Moment - This was her opportunity to get her voice heard. And guess what, she made a difference in this process, and that was the 'aha' moment. That happens all the time, and you can't predict it. You don't know who it's going to happen to. But you can see the light bulb going on in the room as folks start getting it...
Who Is the Best Person to Select the KPIs for a Sales Management Dashboard? - Selecting the KPIs for a sales management dashboard is a critical task that requires a deep understanding of the organization's sales objectives, strategic priorities, and operational processes. The best person to undertake this responsibility is often a cross-functional team comprising individuals with expertise in sales, marketing, finance, and data analytics..
Who Uses Executive Program Management Dashboards? - Executive Program Management Dashboards are used by a wide range of organizations across different industries. These dashboards serve as a crucial tool for senior executives, program managers, and decision-makers to gain real-time insights and monitor key performance indicators (KPIs) related to various projects and programs. Here are some of the types of organizations and professionals who commonly use...


