InetSoft's BI Application | The Alternative to Excel Charts
Executives are always on the hunt for a good alternative to Excel charts because Excel reporting styles are limited, the visualizations are primitive, and analysis is tedious.
With Excel, proficiency comes with memorizing, to the point of rote, specific formulas. In essence an Excel user needs to think in Excel code and language. This makes the program inaccessible to non-technical users who need to ask their data sets lots of nuanced and specific questions. Over the long term a business is hamstrung by Excel, where only a handful of employees have the know-how needed to get the most out of the program.
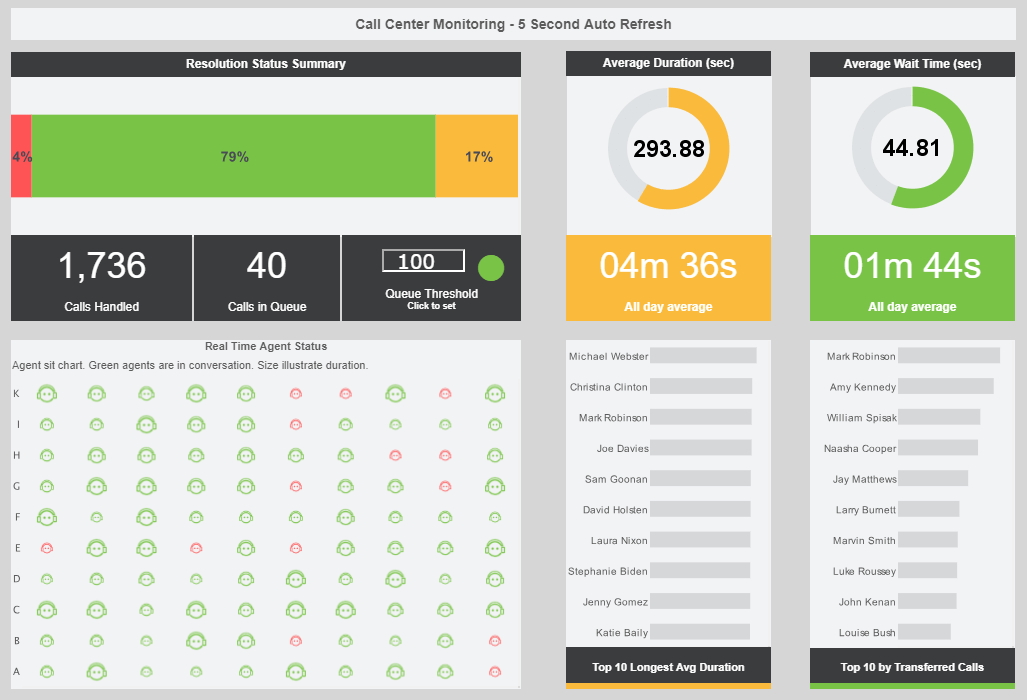
That's why InetSoft has developed the perfect visual alternative to Excel charts. Our flagship BI software, StyleBI, uses a sophisticated data reading structure and drag and drop technology to render charts and visuals, incorporating already existing Excel file types. This means visualizations can be experimented within a self-service environment by anyone, of any technical level, and complex dashboards update whenever the source file is changed.
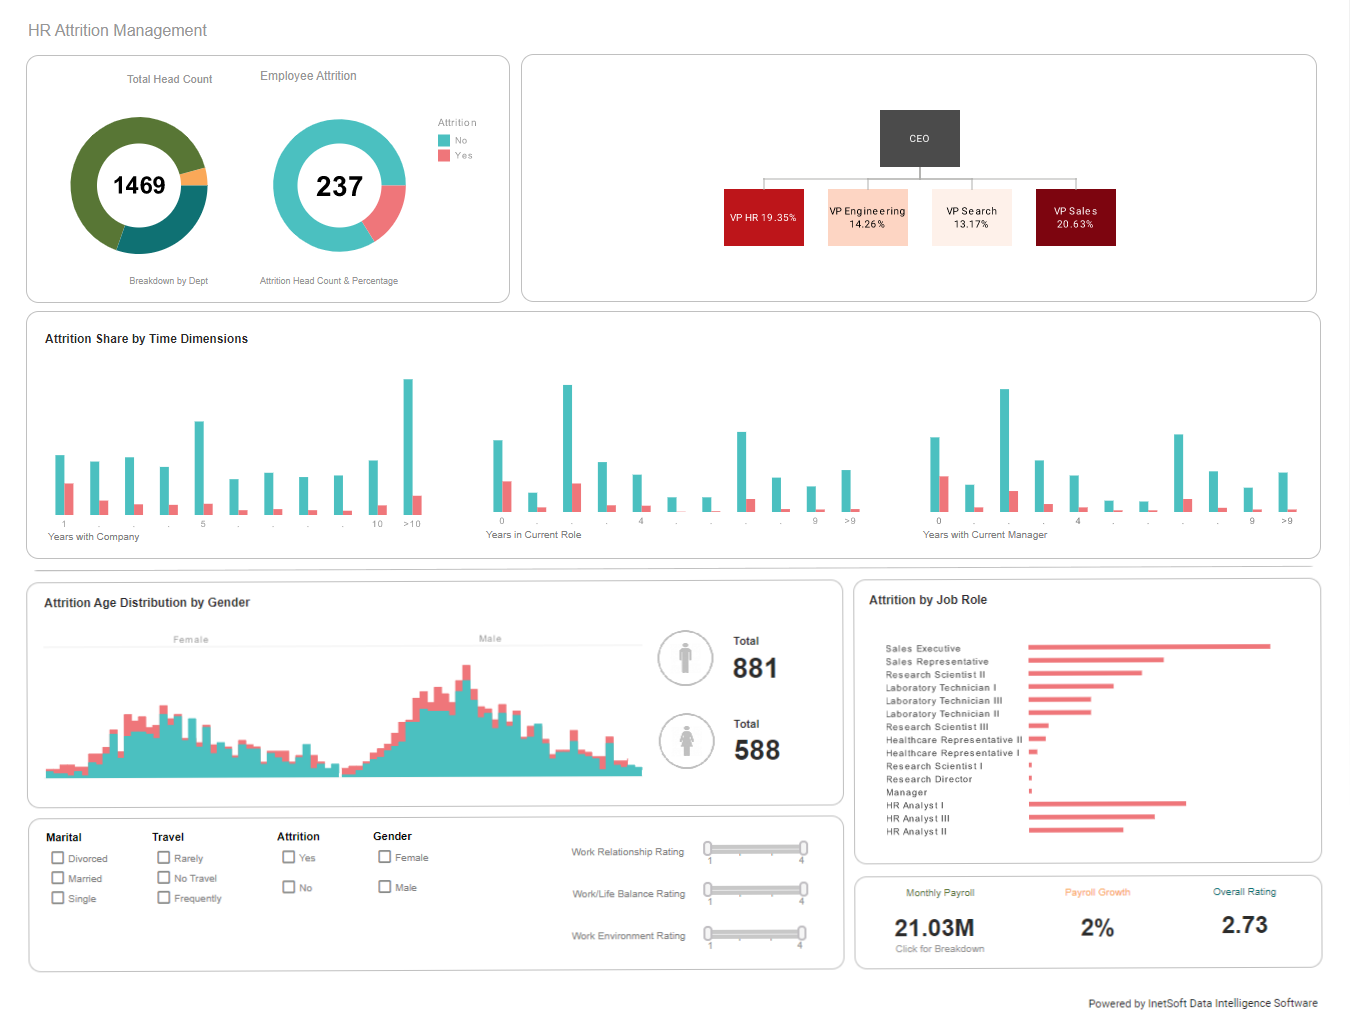 coronavirus_test_numbers_dashboard
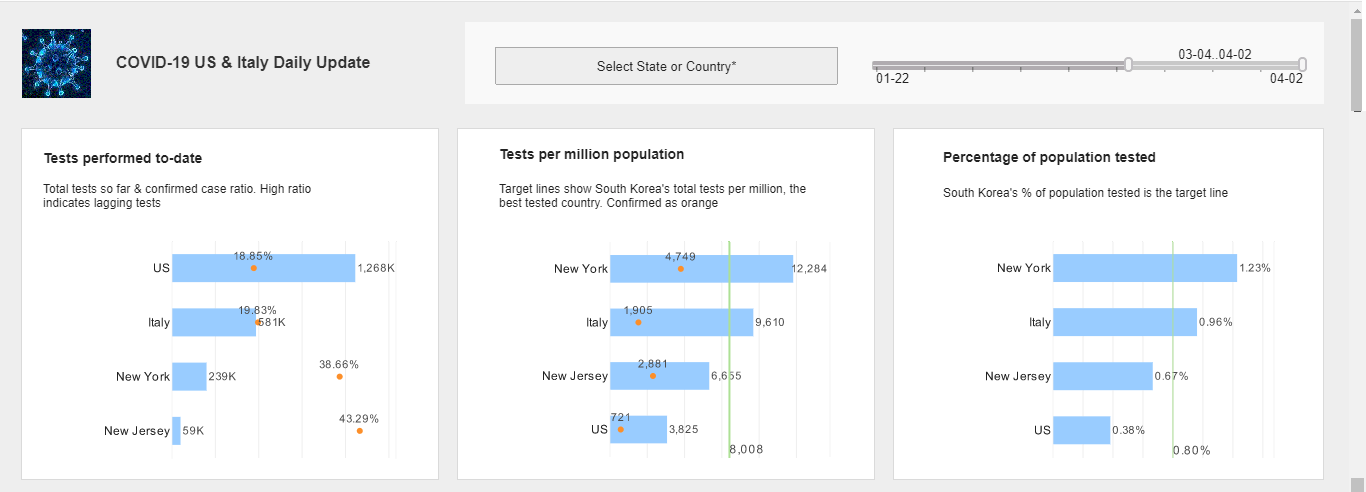
Furthermore, rather than require the user to define new visuals, or compose new formulas all the time for every new data question, StyleBI performs all the math for rendering visuals on its own, automatically figuring out the best way to display data.
With the visualization math taken out of human hands there are no more errors associated with mistyped formulas, accidentally altered data or corrupted data files, because the user is only utilizing the BI software and is not touching the data itself.
All that is required of the end-user is to drag and drop their data columns into the interactive environment.
This an important feature, as history has shown Excel spreadsheets may not always be as reliable as they appear. Federal agencies launched an investigation into Fannie Mae's accounting practices because of errors on an Excel spreadsheet that made the corporation look $1.3 billion more profitable than it really was.
Visualize Better Than Excel | StyleBI
To visualize charts, Excel demands the user enter their own, often complicated and tedious, formula instructions that fall apart if even a single cell of information is formulated out of order when the user is entering the code. To contrast, StyleBI automates the formula, literally reading the spreadsheet and building the charts for you, and responding correctly without user mathematic input, every time, with every available cell included.
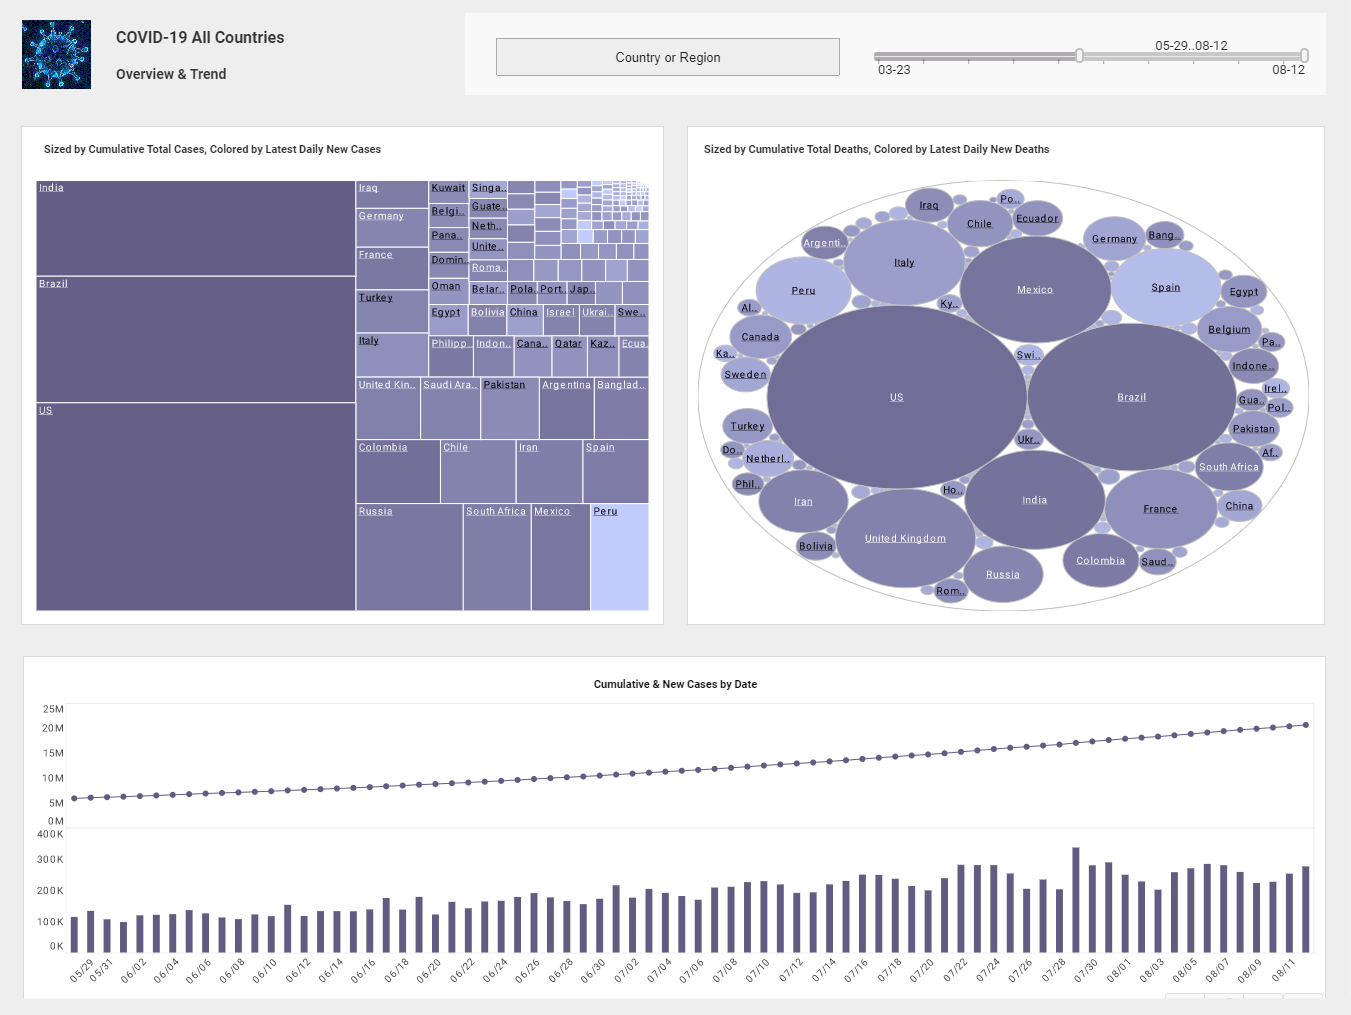
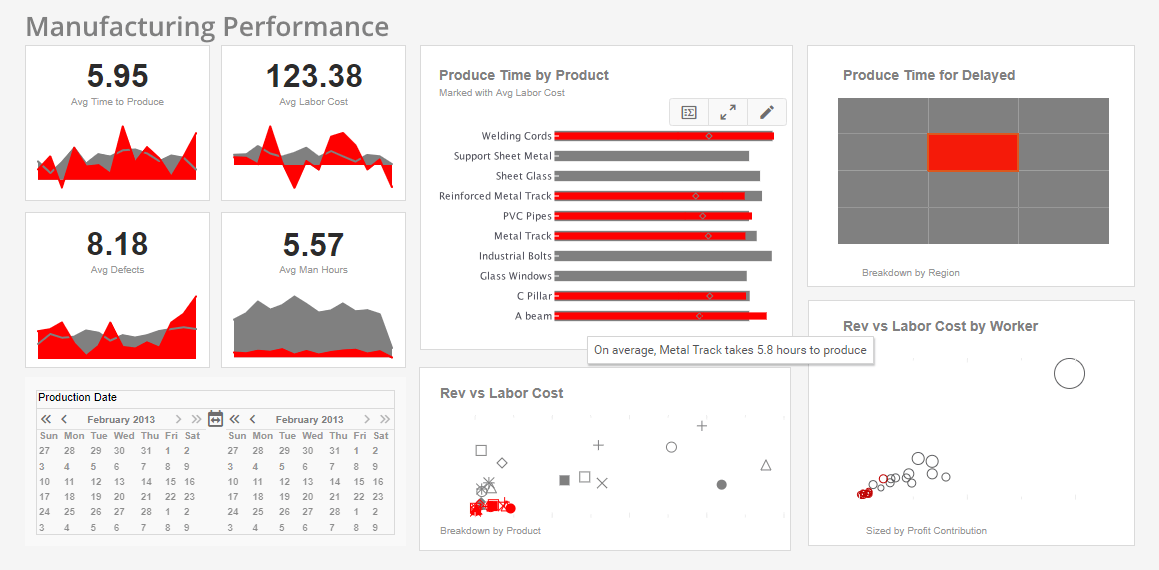
Graphs and charts have hidden results that are unlocked with an interactive technology called "Tooltip." Hovering the cursor over any plot point on a chart will display specific data, relations, and aggregations.
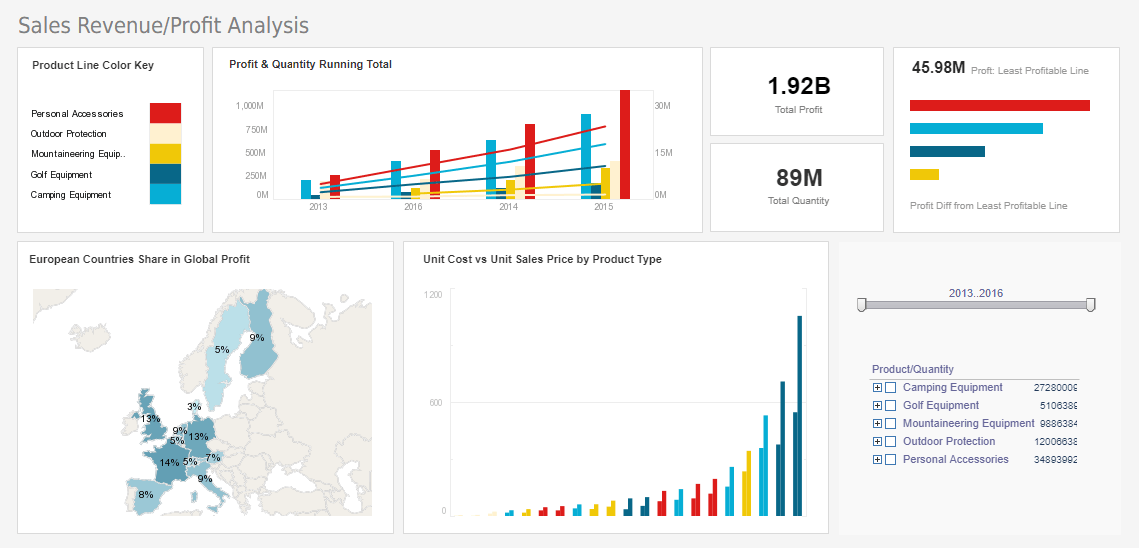
And with a deep reservoir of visual options, StyleBI allows an incredible level of fine tuning. But the key to its strength is highly flexible interactivity. Highlighting data, zooming in on charts, excluding data sets, selection lists and drop down menus that uniformly modify visuals live during presentations, all come built into the product.
All of this together makes a business's reports much more accurate and presentable than what a simple spreadsheet software such as Excel is capable of producing.
Alternatives to Excel as a Datasource
If a business's Excel files are getting so big that it is becoming time consuming to add new rows and columns of data and they find they are navigating dozens of tabs and sheets, it is time to switch to simple databases.
There are free types of database software, such as MySql or MSSaS, which StyleBI effortlessly connects to. InetSoft designed StyleBI with growing needs in mind and the application is compatible with a wide variety of databases, engaging businesses of any size.
Since 1996 InetSoft has been delivering easy, agile, and robust business intelligence software that makes it possible for organizations and solution providers to simply and effortlessly deploy and embed full-featured business intelligence strategies.
InetSoft solutions have been deployed at over 5,000 organizations worldwide, spanning all types of different industries, including many Fortune 500 companies. To learn more about the InetSoft solution, you can visit the interactive gallery and explore its many visualization styles.

