Automated Reporting Tools
Gathering and analyzing data by hand can become a daunting and ineffective approach in creating reports for your organization. What's more frustrating is doing all the work to get results that doesn't satisfy your needs.
Traditional BI methods, although useful, can sometimes feel outdated and slow. In some cases, it can have adverse effects on your organizational goals.
At InetSoft, we've transcended those conventional methods with our innovative automated reporting tool, Style Report.
With Style Report's unique automation functions, the productivity and quality of your data-driven reports are guaranteed to be satisfying. By saving time and energy, your organization will benefit in both the quantity and quality of its reports.
Want to learn more? Contact us for more information and we'll make sure to guide you along the right path.
| #1 Ranking: Read how InetSoft was rated #1 for user adoption in G2's user survey-based index | Read More |
InetSoft's Automated Reporting Tools Features
As a 100% web-based reporting platform, Style Report brings powerful and user-friendly tools to the table. Ideal for all organizations, this solution combines effectiveness, efficiency, and relevancy to bring your organization the right solution to your needs and wants.
Featured in this reporting tool is a long list of options including, but not limited to, real-time viewing, queued reports to email, and/or server and client-based printing. Users will have full control over the data they want to utilize and present for simplified and/or thorough viewing and analysis.
In addition to all the favorable options, users can customize their reports using the software's word processor and HTML-like layout, exclusive library of presentation elements, and expanding formula tables. Other services include configurable data and report page cache, simultaneous report threading control, clustered reporting, and bursting and scheduled reports.
 |
View a 2-minute demonstration of InetSoft's easy, agile, and robust BI software. |
Automation=Efficiency
When one thinks of automation, one think of efficiency. Any organization loves efficiency when it comes to getting the job done, but that is without sacrificing quality of reports. Then the question is how do you get a good balance of quality and efficiency without losing out on the other?
The problem with some of the other traditional BI services offering automated reports is that although many reports can be made in a quick manner, sometimes the results are either not what you're looking for or full of errors.
InetSoft has that problem covered. Combined with our powerful visualization software, our reporting solution can help your organization create multiple reports with detailed, correct, and significant information in a timely manner. This allows you to spend the time wasted on creating the reports by going over the report, saving both time and money.
InetSoft's automated reporting software has simplified users’ abilities to run queries, prints reports, and download all the information needed to manage costs and build customs compliance audit trails. Users also have that information pushed automatically to them on a scheduled basis. Among other new options are additional formatted reports and automated data file outputs in Excel format.
We support agile BI by eliminating the upfront effort of creating a data warehouse, and instead providing data mashup. When you have the application (reports and dashboards) designed the way you want it, then you can setup a Data Grid Cache to make it perform better. By having the data transformation be virtual, it is much faster to create and much easier to change.

 |
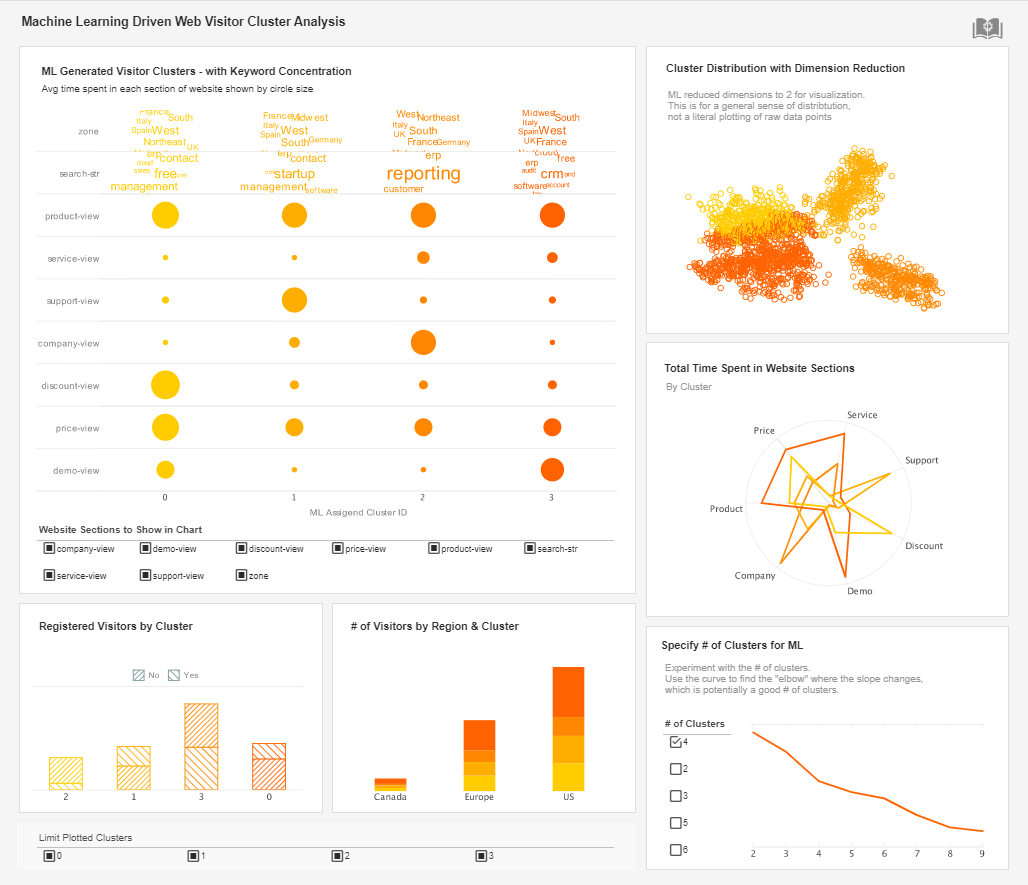
View live interactive examples in InetSoft's dashboard and visualization gallery. |
InetSoft's Automated Reporting Tools Help
- Create easy to manipulate and read graphics for reports
- Produce reports in large volumes to satisfy needs and wants
- Build interactive charting and dashboard software
- Eliminate pesky errors
- Increase productivity
- Decrease costs and time spent
- Improve consistency in relevant report creation
- Simplify the production process
