BI and Mobility Solutions
When you hear the phrase "BI and mobility solutions," what do you think of? Is it possible? How is it done?
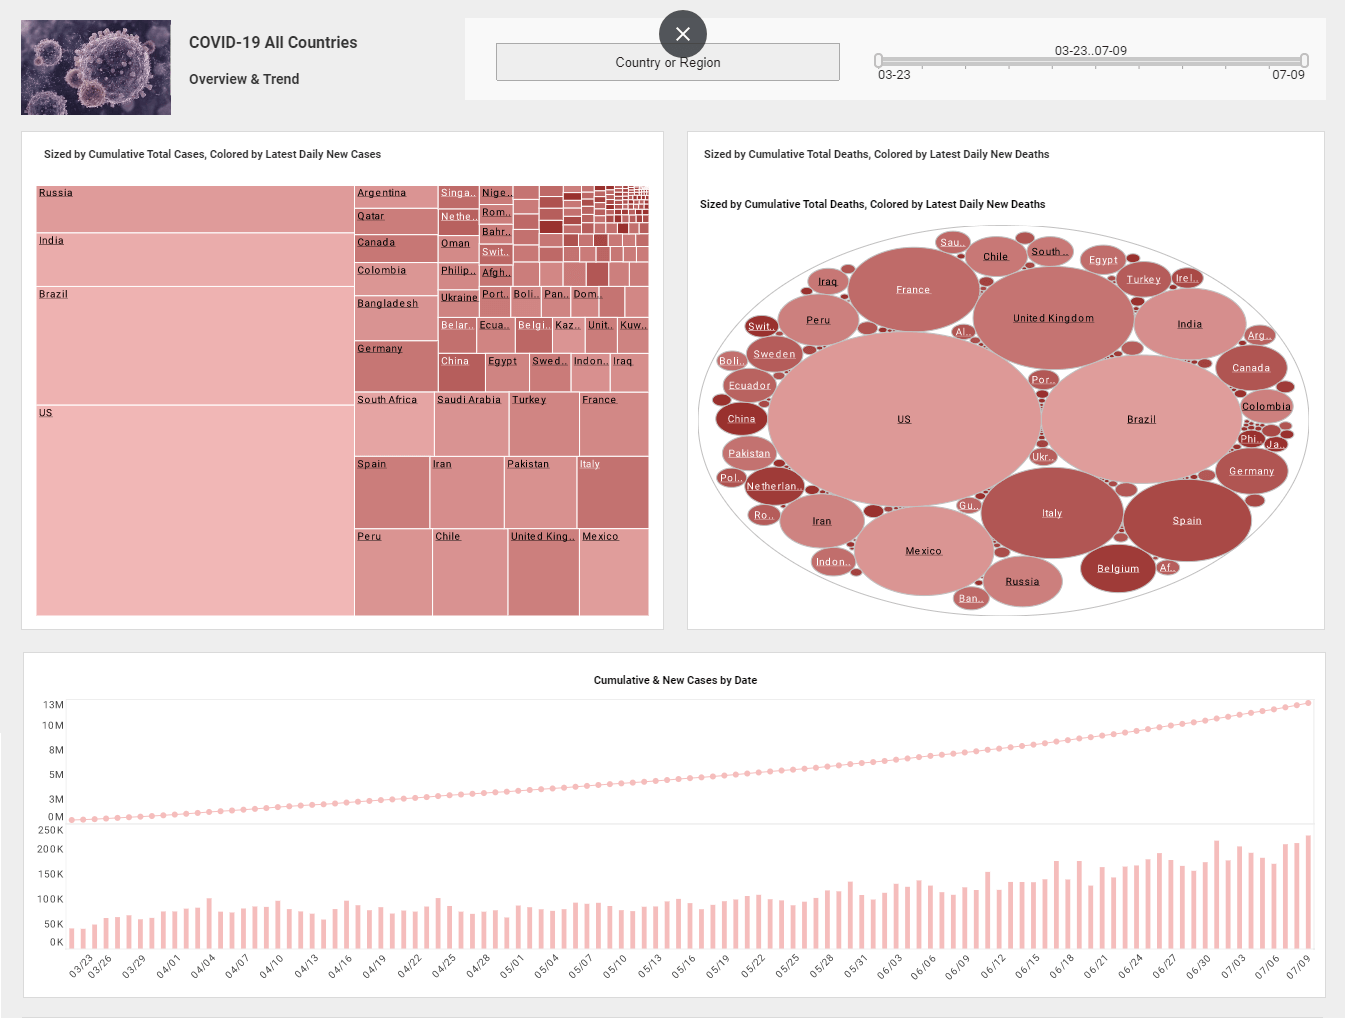
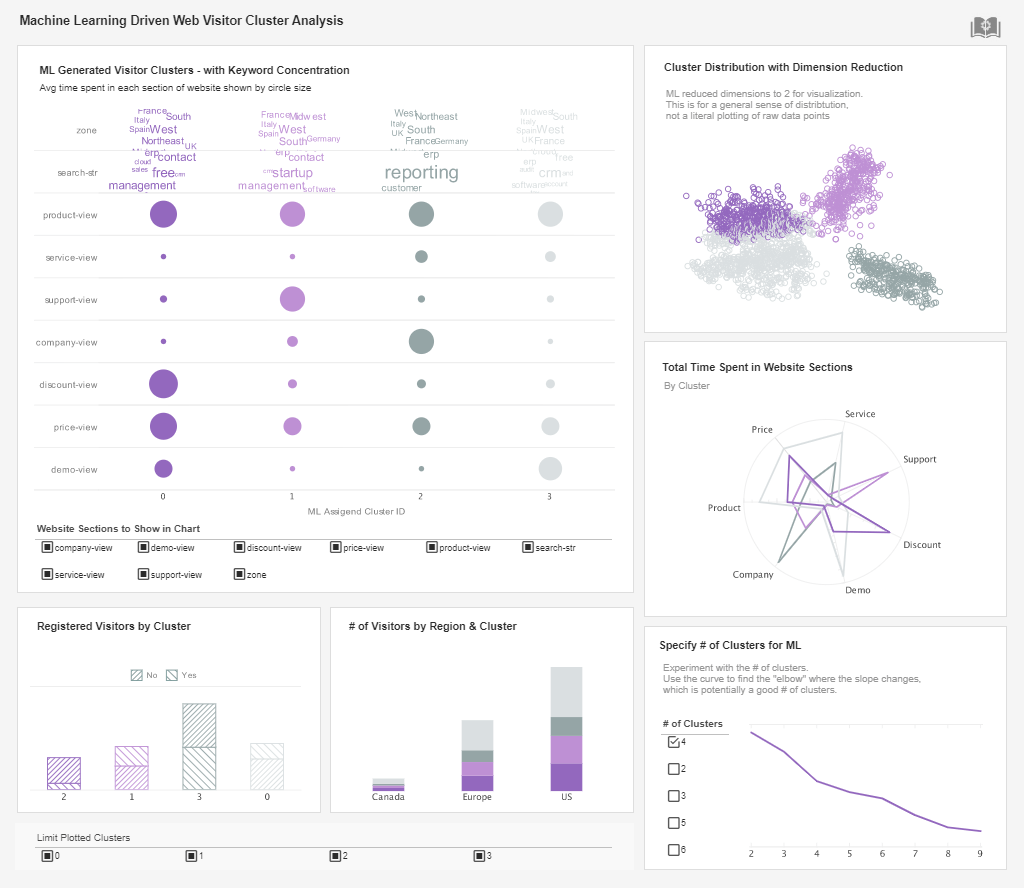
InetSoft's operational business intelligence platform, StyleBI, is mobile friendly, supported on iPhones, iPads, and Android-based tablets. With InetSoft's solution, you can design a mobile-optimized dashboard that has the same data mashup, querying, and transformation layer as the desktop version.
This design-one, deploy everywhere approach allows you to easily equip your users with mobile BI.
| #1 Ranking: Read how InetSoft was rated #1 for user adoption in G2's user survey-based index | Read More |
Benefits of Increased Mobile Business Intelligence
Tablets such as the iPad are becoming more and more commonplace in organizations today, mainly because of their portability and ease-of-use.
With mobile BI, your users won't need to lug around a heavy laptop in order to access important insights. With round-the-clock accessibility, users are capable of accessing actionable information when and where they need it.
Access to mobile dashboards also provides a huge advantage for sales professionals operating on site or in the field. Customer questions can be answered immediately, raising satisfaction rates and improving efficiency.
Since mobile BI can be deployed to twice as many people as BI on a deskop, adopting mobile BI goes a long way in making BI pervasive across your organization.
What KPIs and Metrics Are Tracked in a Field Service Mobility Dashboard for Cable Company Technicians?
In a field service dashboard tailored for cable company technicians, several key performance indicators (KPIs) and metrics are typically tracked to ensure efficient operations and high-quality service delivery. These metrics help management assess technician performance, identify areas for improvement, and ensure customer satisfaction. Here are some common KPIs and metrics tracked in such a dashboard:
-
First-Time Fix Rate (FTFR): This metric measures the percentage of service calls resolved on the first visit without the need for follow-up visits. A high FTFR indicates efficient problem resolution and reduces customer inconvenience.
-
Mean Time to Repair (MTTR): MTTR measures the average time it takes to repair or resolve a reported issue. Lower MTTR values indicate faster issue resolution and improved customer satisfaction.
-
Response Time: This metric tracks the time it takes for a technician to respond to a service call after it is assigned to them. Prompt response times are crucial for meeting customer expectations and minimizing downtime.
-
Service Level Agreement (SLA) Compliance: SLA compliance measures the percentage of service calls that are resolved within the agreed-upon timeframe specified in the service level agreement with customers. Adhering to SLAs is essential for maintaining customer satisfaction and loyalty.
-
Customer Satisfaction (CSAT) Score: CSAT scores provide feedback on customer satisfaction levels following service interactions. Technicians may collect feedback through surveys or direct communication with customers. A high CSAT score reflects positive customer experiences and indicates effective service delivery.
-
Work Order Completion Rate: This metric tracks the percentage of assigned work orders that technicians successfully complete within the specified timeframe. It helps gauge technician productivity and workload management.
-
Travel Time: Travel time measures the time spent by technicians traveling to and from customer locations. Minimizing travel time improves operational efficiency and enables technicians to attend to more service calls.
-
Parts Usage: Tracking parts usage helps monitor inventory levels and ensures that technicians have access to the necessary equipment and materials to complete service tasks promptly.
-
Technician Utilization Rate: This metric calculates the percentage of time that technicians spend actively engaged in service activities compared to their total available working hours. Maximizing technician utilization optimizes workforce efficiency and resource allocation.
-
Safety Incidents: Monitoring safety incidents helps ensure the well-being of technicians and reduces the risk of workplace accidents. This metric tracks the number of safety incidents, near misses, and compliance with safety protocols.
More Resources About BI Mobility
73 Application Connectors Increase Data Mashup Possibilities - InetSoft Technology, a pioneer in data intelligence, analytics, and reporting, announced the general availability of its 2020 Release. Headlining the updates in this release is the expansion of the data ecosystem, with new connections to 73 cloud-based enterprise applications. The next notable enhancement is the addition of 6 advanced chart types for an even wider range of options for data visualization...
A Portfolio of BI Solutions - We have to look at the BI platform and solutions that are out there as more of portfolio of BI solutions to deliver capabilities to the business, versus it just being a standard BI platform or BI set of tools that's going to deliver all reporting. It's going to need to be more flexible and have a list of capabilities in the BI space to deliver out to the business user...
Senior Living Assistance Facility Providers Use Dashboards - The people working in that organization will be more focused and will turn out to be more productive. By measuring and analyzing your spending, you can find out where you are spending too much money on things that do not bring any benefits to your company...
Top Performers Implemented Mobile Business Analytics - One is, if you look here on this slide, we are looking at leaders versus followers, and this is based on organizations that have implemented in this case, looking at mobile business analytics or mobile decision support with leaders of the top 35 percent...


