BI Comparison: InetSoft Against Tableau and Qlik
Are you deciding which BI solution to implement for your enterprise? If Tableau and/or Qlik are among your options, take a look at how InetSoft compares to these competitors.
InetSoft is a Java-based application that can be run on any operating system, such as Windows, Linux, Solaris, HP Unix, and Mac OS. Tableau and Qlik are Windows centric and can only be run on Microsoft Windows operating systems.
InetSoft only requires a one-time installation process and can be quickly deployed with minimal IT training. Being a zero-client web-based platform, the BI application maximizes self-service to its users. For visualization design, Tableau only provides a thick desktop developer tool that must transfer data from the web server onto the desktop, requiring a desktop plugin.
InetSoft's empowers self-service to its users for all InetSoft features, including data mashup, reporting and dashboarding. Qlik's customizations are restricted for dashboard usage and all other functions need to be performed via a Windows desktop tool.


 |
Read the top 10 reasons for selecting InetSoft as your BI partner. |
Get the Most Out of Your Data
InetSoft's signature enterprise data mashup engine enables users to extract from data from virtually any source and make unique combinations, for company wide analysis within a single view. The proprietary Data Block Technology automatically writes real-time queries as users drag and drop fields from different data sources.
Overshadowed by these features, Tableau uses a data blending service feature with simple joins; no customization, control, or reusability. Qlik does not have a data mashup function, but requires an ETL and database procedure, which in turn, is not as efficient and creates latency in the acquiring of new data sources.
Recent editions of InetSoft's StyleBI also include the options of database write-back and data entry capabilities. This full-lifecycle BI allows users to not only interact with their data using dashboards and reports, but to also massage data and make corrections to their data sources using these tools. Tableau and Qlik lack these data input and write-back capabilities.
 |
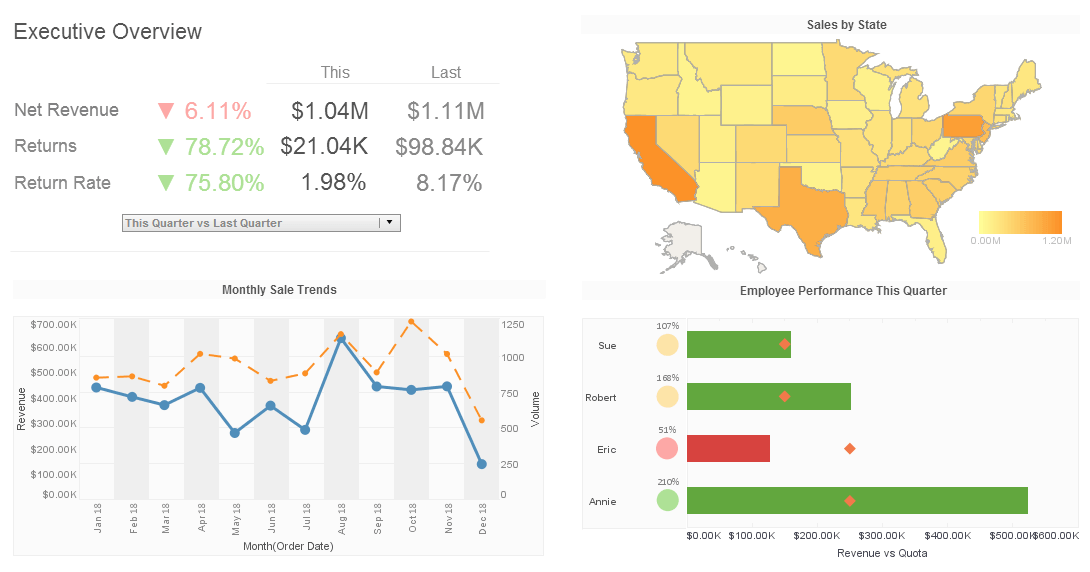
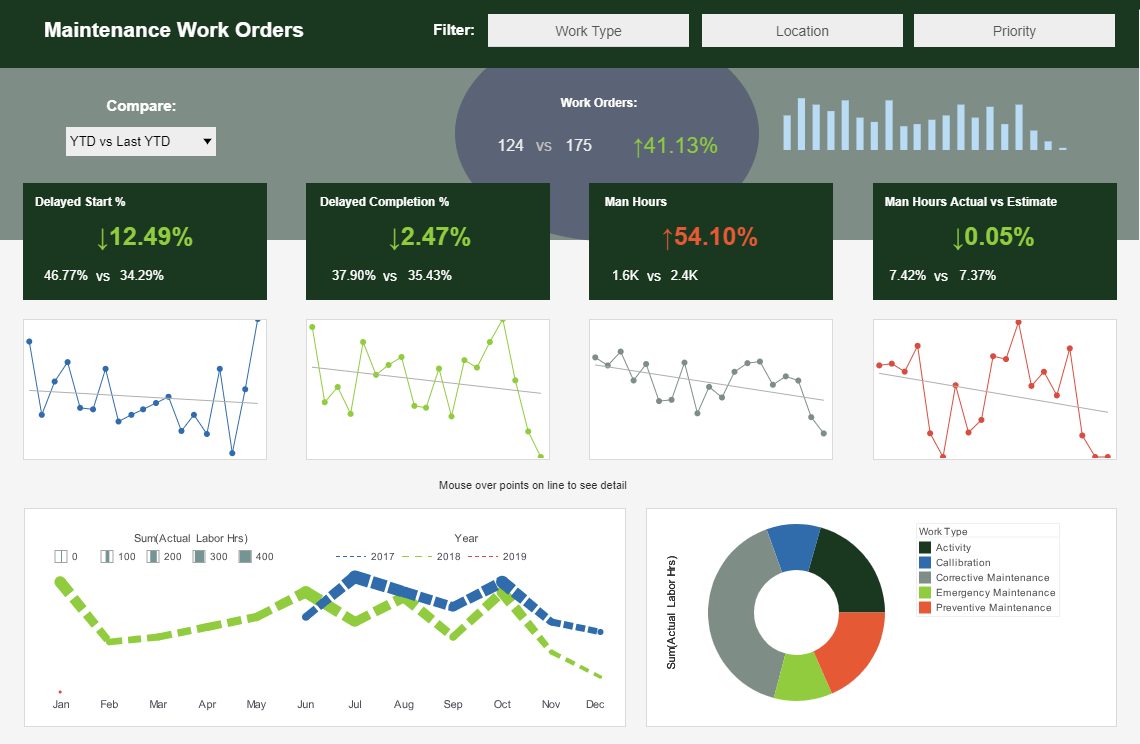
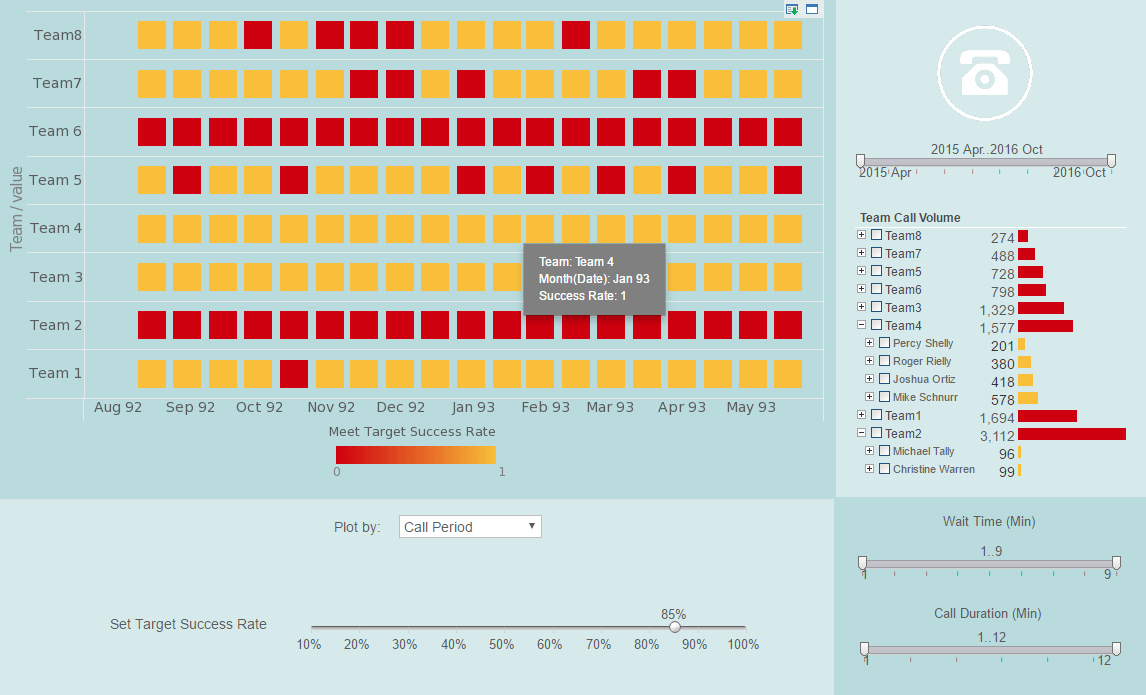
View the gallery of examples of dashboards and visualizations. |
Advanced Visualizations and Reports
InetSoft renders its users with superior capabilities for generating visualizations and reports that stand out against Tableau and Qlik. StyleBI users can explore and analyze their data without any boundaries.
Using an intuitive drag-and-drop interface, multiple objects per sheet can be added with multiple sheets per dashboard container. Tableau, on the other hand, only allows a single object per worksheet, with multiple worksheets per workbook. Qlik only goes as far as multiple objects per sheet. With InetSoft, users can fully customize and structure multi-dimensional dashboards, allowing them to better interact with their data and reveal important business information.
StyleBI fully supports paginated reports with pixel perfect quality and prompt publications, a capability that is completely absent with the Tableau and Qlik BI platform. InetSoft also includes advanced features such as scheduling, archiving, versioning and auditing that are driven by modern reporting needs.
Take a quick look at InetSoft's demo and see for yourself how easy, agile, and robust StyleBI is.

 |
View a 2-minute demonstration of InetSoft's easy, agile, and robust BI software. |
How Does InetSoft Compare to Qlik for Enterprise Reporting?
Comparing InetSoft and Qlik for enterprise reporting involves examining various aspects such as features, ease of use, scalability, integration capabilities, and pricing. Both InetSoft and Qlik are well-regarded in the business intelligence (BI) industry, but they have distinct strengths and use cases.
1. Features:
InetSoft:
- Data Mashup Capabilities:
- InetSoft excels in data mashup, allowing users to combine data from multiple sources without extensive ETL processes. This is beneficial for organizations that need to integrate diverse datasets quickly.
- Interactive Dashboards:
- Provides highly customizable dashboards and visualizations, enabling users to create tailored reports and visual analytics.
- Flexible Deployment Options:
- Can be deployed on-premises, in the cloud, or in hybrid environments, offering flexibility based on organizational needs.
- Real-Time Data Processing:
- Supports real-time data processing and visualization, which is critical for businesses that require up-to-the-minute insights.
- Embedded BI:
- Strong capabilities for embedding BI reports and dashboards into other applications via APIs, enhancing the functionality of existing systems.
Qlik:
- Associative Model:
- Qlik's associative model allows users to explore data freely, revealing hidden connections and insights that traditional hierarchical data models might miss.
- Qlik Sense and QlikView:
- Offers two main products: Qlik Sense for self-service analytics and QlikView for guided analytics. This bifurcation caters to different types of users and use cases.
- Advanced Analytics Integration:
- Integrates well with advanced analytics and machine learning tools, allowing for sophisticated data analysis.
- Smart Search:
- Provides smart search capabilities that enable users to quickly find and analyze relevant data points across datasets.
- Cloud and On-Premises Deployment:
- Offers both cloud and on-premises deployment options, with a strong emphasis on cloud capabilities.
2. Ease of Use:
InetSoft:
- User-Friendly Interface:
- Designed with a focus on ease of use, making it accessible to both technical and non-technical users.
- Drag-and-Drop Functionality:
- Offers intuitive drag-and-drop features for creating dashboards and reports, reducing the learning curve.
Qlik:
- Interactive and Intuitive:
- Known for its intuitive user interface and interactive visualizations, which enable users to explore data in a flexible and dynamic manner.
- Learning Curve:
- While Qlik Sense is user-friendly, QlikView can be more complex and might require more training for new users.
3. Scalability:
InetSoft:
- Scalable Architecture:
- Scalable to accommodate the needs of growing enterprises, with the ability to handle large volumes of data and concurrent users efficiently.
Qlik:
- Highly Scalable:
- Designed to scale from small teams to large enterprises, Qlik can manage extensive datasets and high user loads without significant performance degradation.
4. Integration Capabilities:
InetSoft:
- Diverse Data Source Integration:
- Strong in integrating a wide range of data sources, including databases, cloud services, and third-party applications.
- API Support:
- Robust API support for embedding analytics into other applications and workflows.
Qlik:
- Broad Data Connectivity:
- Offers extensive data connectivity options, integrating with numerous data sources, including big data platforms, ERP systems, and cloud services.
- Third-Party Integrations:
- Supports a wide array of third-party integrations, enhancing its utility in complex enterprise environments.
5. Pricing:
InetSoft:
- Flexible Pricing Models:
- Pricing is typically more flexible and can be tailored to the specific needs and scale of the organization.
- Cost-Effective:
- Generally considered cost-effective, especially for small to medium-sized businesses.
Qlik:
- Premium Pricing:
- Qlik's pricing tends to be on the higher side, reflecting its robust feature set and enterprise capabilities.
- Subscription-Based:
- Offers subscription-based pricing with options for both small teams and large enterprises.
6. Support and Community:
InetSoft:
- Customer Support:
- Provides dedicated customer support and professional services to assist with implementation and ongoing use.
- Documentation and Training:
- Offers comprehensive documentation and training resources.
Qlik:
- Extensive Community:
- Boasts a large and active user community, providing peer support, forums, and extensive resources.
- Professional Services:
- Provides robust professional services and support options, including training and certification programs.
 |
Learn about the top 10 features of embedded business intelligence. |
More Articles About BI Tools
Customer Churn Rate Prediction - Customer churn rate prediction is an unsupervised machine learning method that quantifies the amount of individuals or items moving away from a collective group over a particular period, and therefore is an aid for determining a company's customer base. Business users have the ability to first label a set of users into the churn classes, and then let the machine learning algorithm study the data set to figure out how to do the same classification automatically...
Interactive Visualizer Tool - InetSoft's online data visualizer stands apart from the rest with the flexibility and interactivity that is offered to users. Not only can dashboards be created using a simple drag and drop interface, but interactive features allow users to drill down and explore data more than ever before. Users can brush, highlight, and isolate data in order to highlight relevant information that can lead to a new discovery of trends that could not be seen before when looking at raw data...
Maintenance Costs of a Data Warehouse - Acquiring and maintaining a data warehouse involves several costs, both upfront and ongoing. It's important to consider these expenses when planning for the implementation of a data warehouse. Keep in mind that the specific costs can vary widely depending on factors like the size of the organization, the complexity of the data infrastructure, and the chosen technology stack. Here's a comprehensive breakdown of the costs associated with a data warehouse...
Solve Data Integration Problems - Let us talk about some other tools and methods that people use to solve data integration problems. First I would like to go to the list of terms that we hear a lot and give short definitions to help put some of them into context, but before we a three letter acronym game, how familiar are people with these terms already? I often ask my clients and people I talk to at conferences and seminars and users groups whether they have heard of these terms. The usual response is no, or maybe one or two of the terms. It is real test to keep track of all the terms since they seem to be created regularly...