Data Analysis Reporting
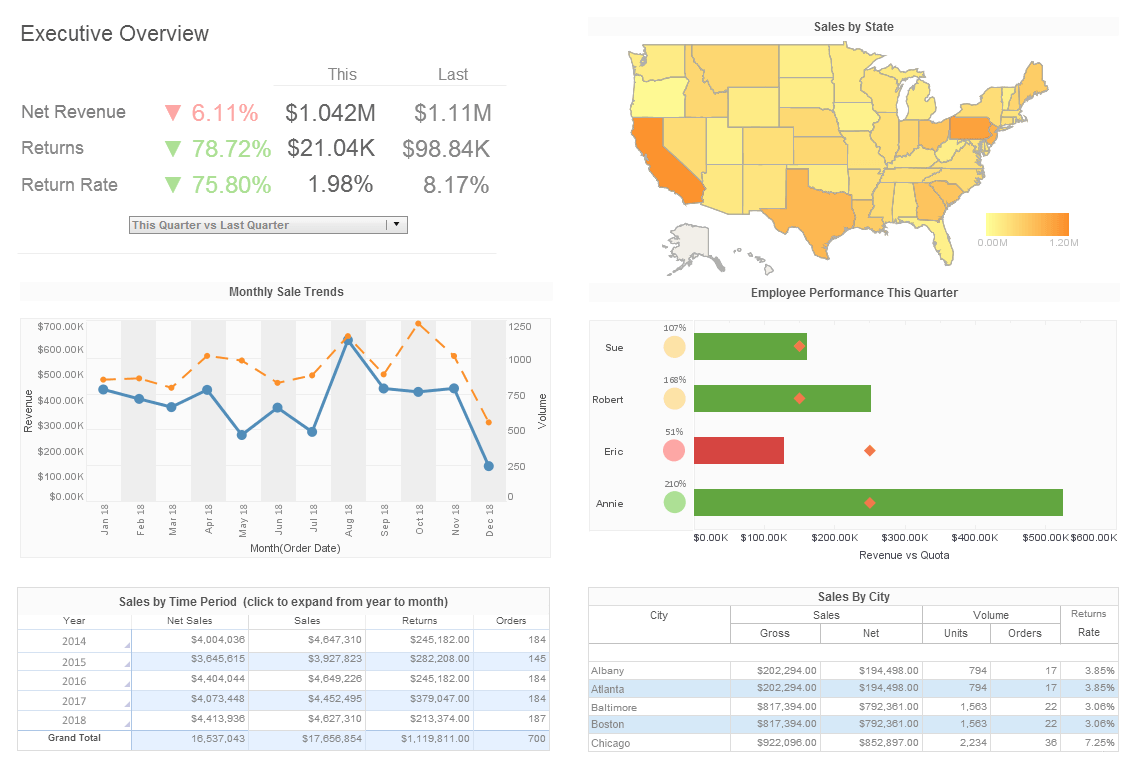
Official reports complete with data analysis are vital for a business to identify their strengths and weaknesses. Data reporting is the process of collecting data and manipulating it to make it clearer for the audience that is analyzing it. For instance, if a business that baked cookies was trying to show an investor the data involving their sales and which months their sales were the highest, they would have a difficult time just showing them the raw data and trying to explain the correlation between the two.
This is where data reporting is useful. Data analysis is standard for any business, but it's important that it's done correctly so internal issues can be identified and resolved. The benefits of data analysis reporting are endless and InetSoft's tool for this purpose can help a business realize their data�s full potential.
InetSoft has a thorough data analysis reporting program that can analyze and manipulate data to make it easier to understand. Data analysis is the process of evaluating data and drawing conclusions.
While some companies might have very detailed data analysis they might suffer from having poor data reporting. Data analysis is useless if you can�t articulate what your data is saying. This is where the implementation of proper data reporting is beneficial.
| #1 Ranking: Read how InetSoft was rated #1 for user adoption in G2's user survey-based index | Read More |
StyleBI for Reporting
InetSoft's StyleBI is an excellent tool for enterprise reporting, generating pixel-perfect production reports and delivering interactive reports in a zero-client, web environment.
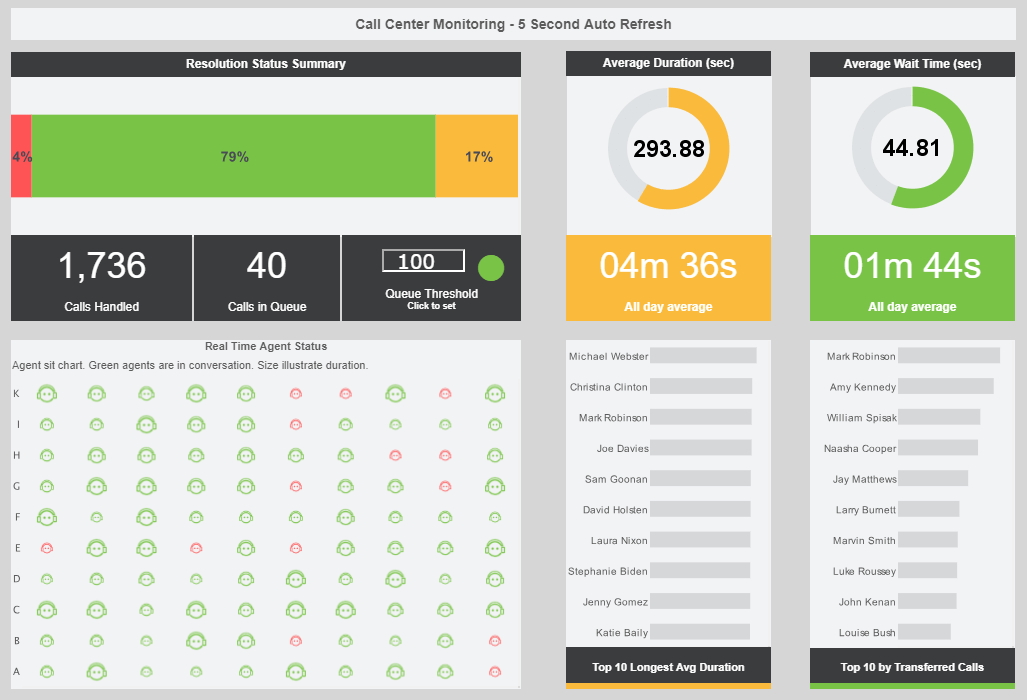
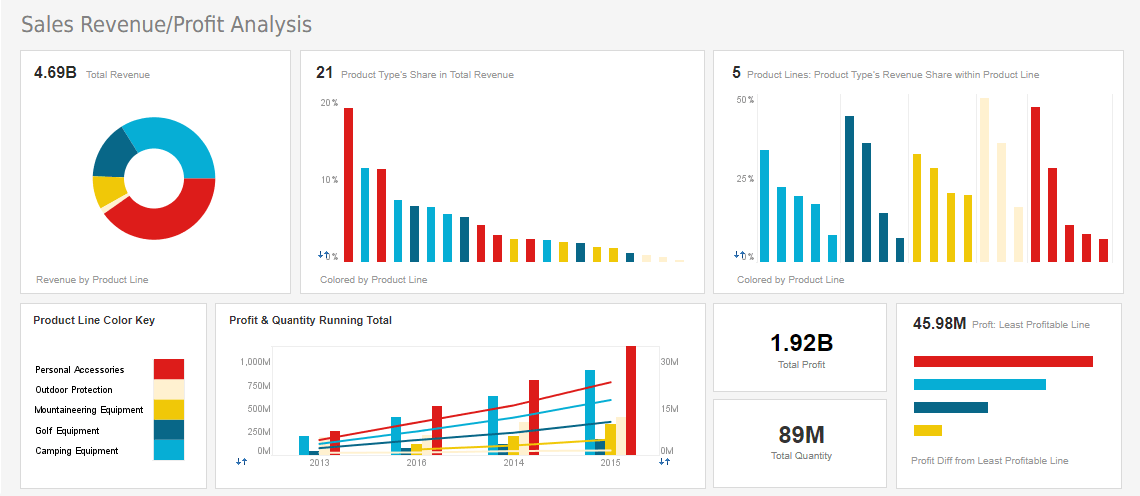
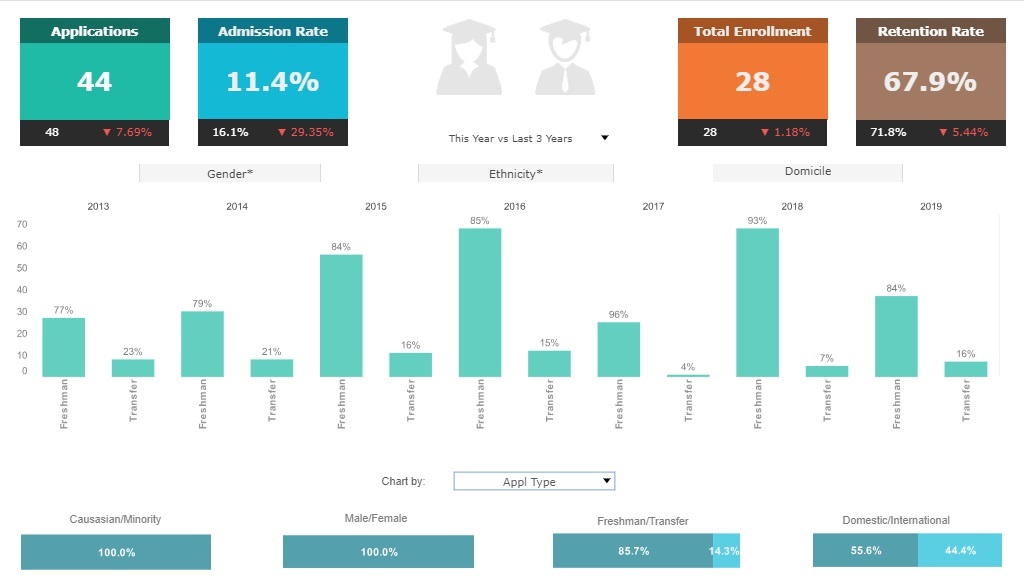
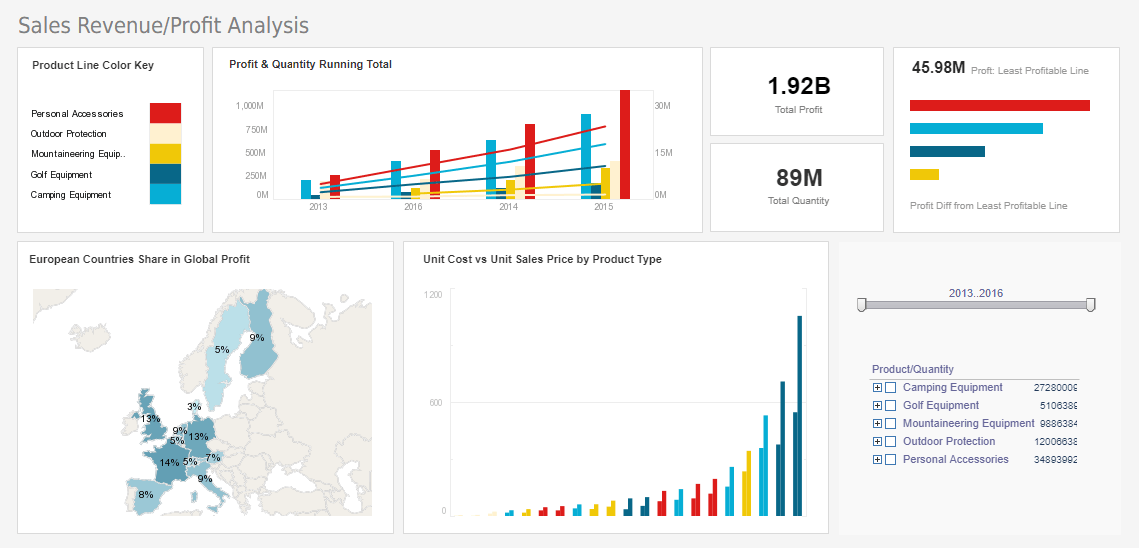
StyleBI puts an array of capabilities at the user's disposal, including web based reporting, production report design, business logic embedding, and interactive report viewing. Web based reporting allows the user to access data reports from any web browser. Production report design and business logic embedding can help manipulate data into a visual format, using charts and graphs to make the data easier to understand and explain.
Interactive report viewing allows reports to be accessed from everywhere as well as edited and manipulated through multiple formats. Mobile reporting is also available from Web-enabled devices including Android-based tablets, smartphones, iPads, and iPhones.
 |
Read the top 10 reasons for selecting InetSoft as your BI partner. |
Scorecards for Monitoring and Measuring Behavior
Scorecards are a clear approach for monitoring and measuring behavior and performance. You can create scorecards that include a list of key performance indicators (KPIs) that compare current performance data alongside goals, quotas, and target trends. The scorecard can also include useful information on what needs to be done if goals are not met.
Scorecards are an ideal solution for tracking dashboard metrics, organizing all the KPIs that would be included in either a business or executive dashboard. With InetSoft's tool, it's easy to create and modify scorecards that help your business more effectively track data and therefore more quickly apply solutions for problems.
Benefits for Financial Reporting
A company's financial information is without question one of the most important data sets to analyze and report properly. Businesses that have multiple locations will find InetSoft's Style Intelligence is particularly useful because it performs the consolidating function that would otherwise require major capital and services outlays to solve. Using StyleBI will also reduce the amount of errors and time spent on organizing a business�s financial data.
The financial data pulled from any company's operational financial systems can be combined with almost any other data source commonly used across multiple industries, including:
- Relational databases (via JDBC)
- Dozens of cloud application sources
- Data warehouses
- XML
- SOAP
- Rest API sources
- EJB beans
- Flat files
- Excel spreadsheets
- OLAP cubes
- And the proprietary data stores from JDE, SAP, PeopleSoft, and Siebel CRM
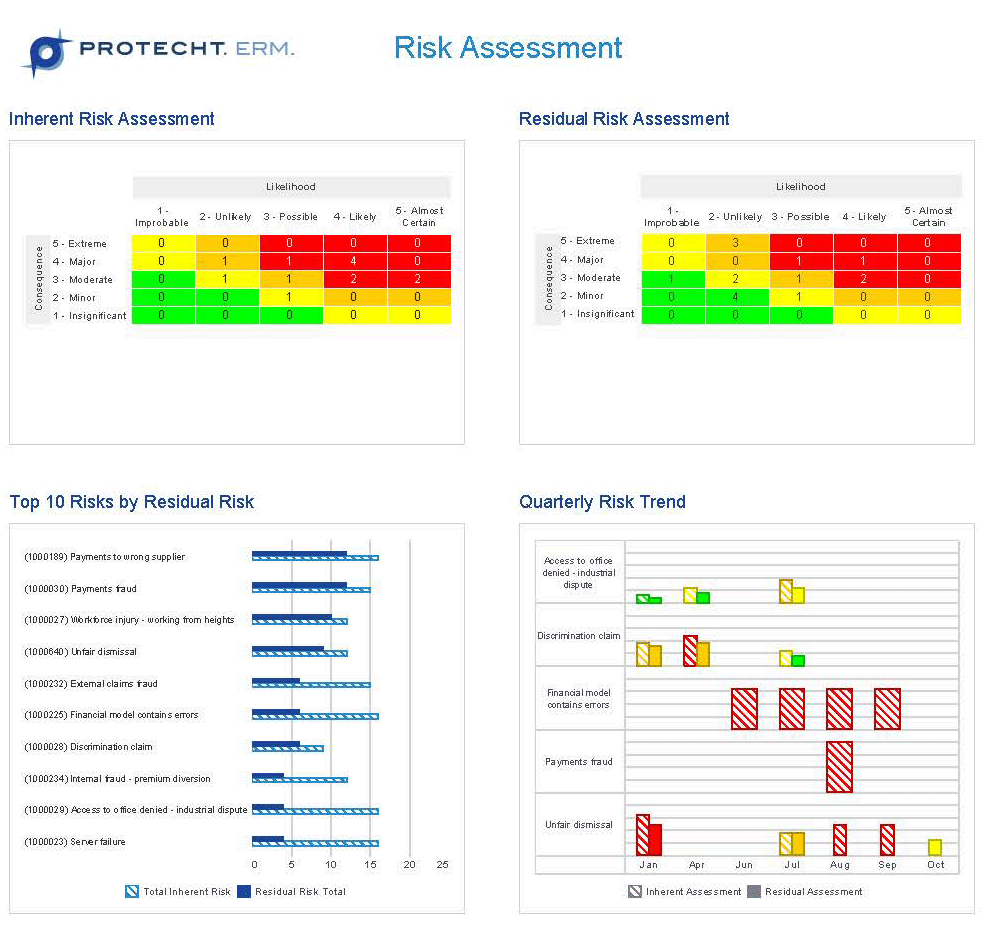
Overall, InetSoft can provide your company with the tools to create the best data analysis reporting possible. Click on the link below the bubble chart to read about how InetSoft was ranked number one by a major BI analyst.
