Demonstrating Self-service BI Capabilities
This is the transcript of a product demonstration provided by an InetSoft sales engineer for an enterprise prospect interested in our business intelligence software.
Let's talk first about data connection options for our BI application. In addition to being able to mash up data from any relational database, there are many other data sources you can connect to. We can connect to an XML file. We have special connectors for SAP and several other ERP applications such as JD Edwards, PeopleSoft, and Siebel. When it comes to other ERP applications as long as there is some interface for another application to connect to, it's usually some sort of API, a Java API, then a connector can be built using our API. But most solutions out there are basically adhering to some standards, some open standard tools like ours can be used to connect to them. Usually there is some sort of API or a JDBC connector that our software can use.
Question: Okay, in terms of self-service abilities, can you just expand on that? Is that basically publishing? What about creating your own dashboards? How does that work?
Self-Service BI Capabilities
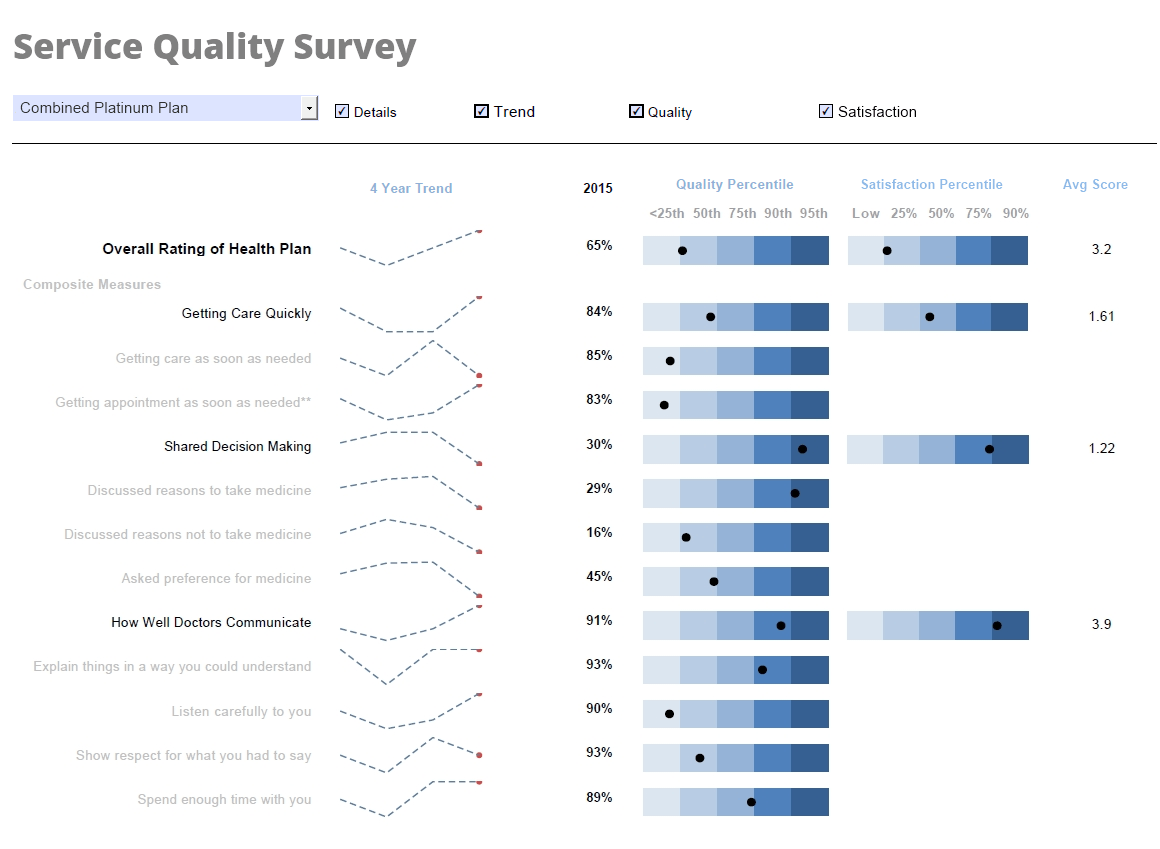
So our visualization module, our interactive exploratory dashboard module is designed to be very user-friendly. By self-service, we mean any business user who is fairly technically savvy, who knows the data, can actually use our Web based tools and their drag and drop interface to very quickly and very easily build their own interactive visualization using their own data. This is also known as ad hoc reporting or on as needed basis, where someone can just go and quickly get their own data without going to IT and suffering from that slow and painful process of getting someone to develop a new report for them.
Question: Can you publish the data? For instance, if you have specific divisions in a company or physical locations, i.e. a UK branch and a US branch, can you make specific versions for each? We have a structure within our data models for our service management solutions to use partitioned data. So we like to follow same scenarios depending on support. It's a 24-hour support office for the UK that is based in the US and the Asia Pacific region.
But they have their own partitions, so they have their own structure sets of data or attributes. So when you have one database, effectively there are three data structures. Obviously you would probably see that as one database from a reporting point of view. But from a reporting point of view, where you mentioned self service, can you set up specific views? Obviously you can make access very secure. But can you make it so certain people only can access certain parts of the data? Can you restrict what they can see also?
Good question, yes, absolutely, and we have an out-of-the-box module for that and actually I will show you that. I will show you an instance of that working.
Question: Okay that’s fine, great.
So you can see my browser window, correct?
Question: Yes.
As you saw from the sales slides, we have three primary functional modules in our product. One is the common foundation which is what we call the data layer, which deals with connecting to your different data sources, querying, and manipulating the data. On top of this data layer, we have a module called visualization, which is basically your interactive exploratory analytic, very dashboard like user data access. Then you have another more traditional reporting module called publishing, which is basically for paginated, pixel perfect, nicely laid out, nicely formatted reports, something you’d would want to print out or deliver via email, very document like presentation of data.
What Are the Top 10 Self-Service Features of StyleBI
- Drag-and-Drop Dashboard Creation: Users can build dashboards without writing code, using intuitive drag-and-drop tools.
- Data Transformation Pipeline: Integrated pipeline allows users to clean, join, and reshape data before visualization.
- Machine-Assisted Design: Smart design suggestions accelerate dashboard creation and improve layout quality.
- Role-Based Access Control: Designers and viewers can collaborate securely with granular permissions.
- Interactive Dashboards: Dashboards support filtering, drill-downs, and dynamic views for deeper exploration.
- Mobile and Desktop Delivery: Dashboards are optimized for both desktop and mobile viewing, ensuring accessibility.
- Scheduled Static Reports: Users can automate delivery of paginated reports via email or other channels.
- Cloud-Ready Deployment: StyleBI can be deployed instantly via Docker or used directly in the cloud.
- Open Source Flexibility: Users can customize and extend the platform thanks to its open-source architecture.
- Self-Service Data Exploration: Business users can explore datasets independently, reducing reliance on IT.
Learn more on the StyleBI product page.


