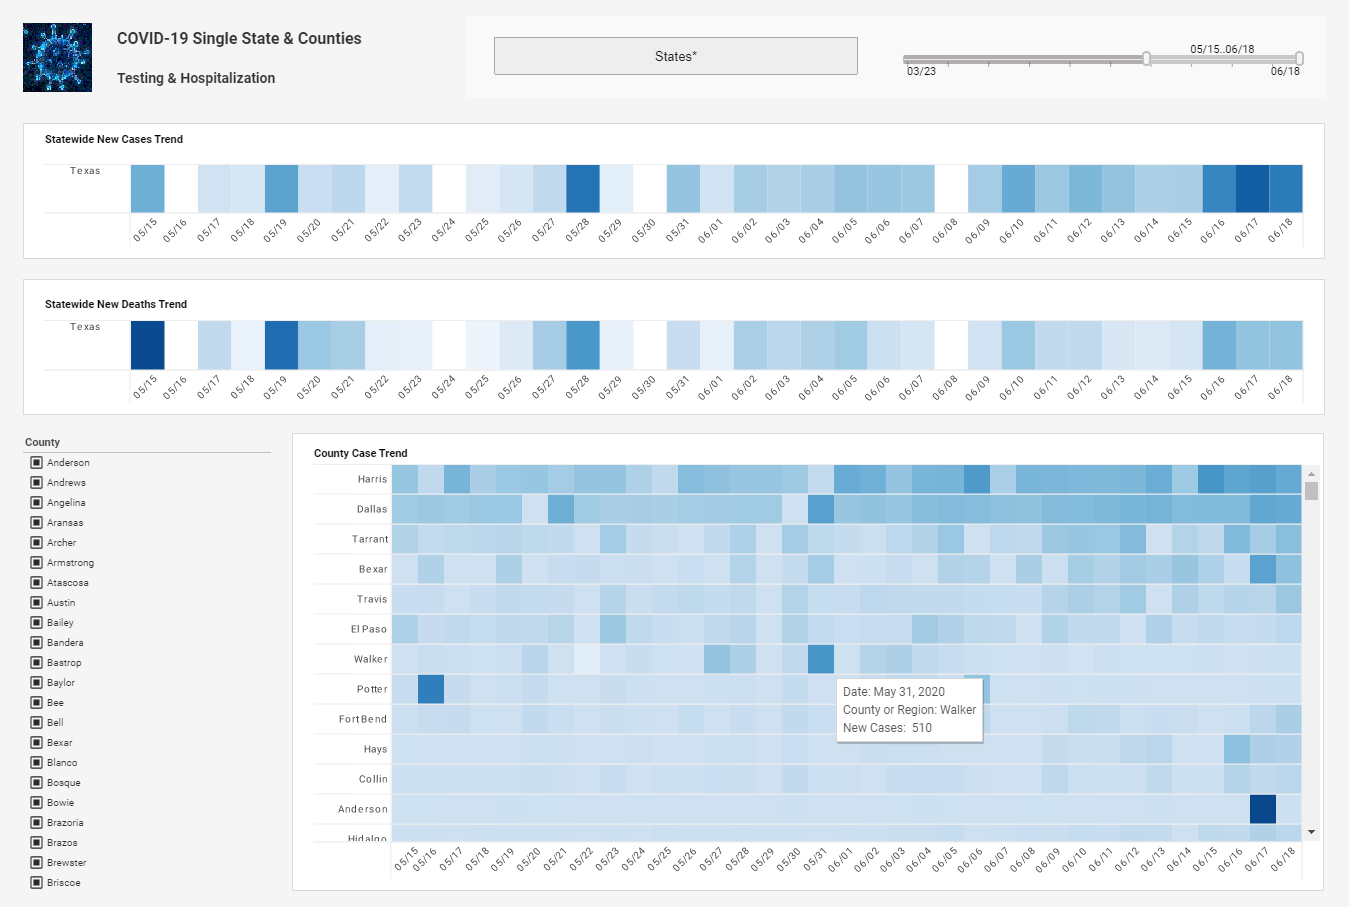
Dynamic Top 10 Rank in a Dashboard Chart
This is a continuation of the transcript of a Webinar hosted by InetSoft on the topic of "What's New in InetSoft's Business Intelligence Software: Mobile BI" The speakers are Mark Flaherty, CMO at InetSoft, and Amy Hynson, Principal Technologist at InetSoft.
Mark Flaherty: Okay so the first question was, can you have a dynamic top 10 rank in a dashboard chart?
Hynson: Yes, absolutely, so the top ‘n’, in this case 10, can be dynamic. So if you wanted the number of top ranked items to be specified by the user maybe even using a slider, that is possible. You could do so with a variable, and you can also do so with script.
Flaherty: Next question is about mobile application development, is there any way to make the checkboxes or drill downs plus or minus controllers, larger so they are easier to hit with the finger?
Hynson: Oh okay. We actually do support the mobile pinch gestures, so you can easily zoom into the dashboard and with a simple double-click do a zoom to screen. So essentially it's just a matter of designing your dashboard to be a little bit smaller and requiring a little bit less real estate so that the users can simply zoom to fill their screen, in which case, all of the controls will scale appropriately.
Flaherty: Okay got it. Another mobile one, are BlackBerries supported?
| #1 Ranking: Read how InetSoft was rated #1 for user adoption in G2's user survey-based index | Read More |
Hynson: So BlackBerries also don’t support Flash especially in terms of the BlackBerry tablets. We have always supported mobile devices with reporting. The latest enhancements were really focused on bringing the interactive dashboards, the viewsheets to mobile devices, and we were targeting the iPad with this release. I have not yet seen it happen or used on a BlackBerry tablet, I imagine that it will work to some extent. There might be some additional tweaking necessary.
Flaherty: Alright, there is question about Flash, so if Apple and Adobe become friends again, will InetSoft go back to the Flash presentation?
Hynson: I feel that the HTML version is probably going to be here to stay. There are advantages to the Flash interface, for example, the chart editing and the full use of the visible composer. So I think that those benefits would probably encourage users to use the Flash interface instead of the HTML one. But we also have just heard of some restrictions in certain environments where for some reason they cannot have the Flash player. So I do think that we are going to be maintaining the HTML functionality that we introduce in this version.
Flaherty: Okay. And how does InetSoft integrate with .NET applications?
Hynson: So integration is typically done at the backend in terms of utilizing the same data source, in which case it doesn’t matter that your front-end might be .NET. On the front-end, integration is most easily done just as if it were a Java environment. Integration is most easily done through iFrame embedding. So that means inside of your website whether it's .NET, ASP, or Python or just raw HTML or JSPs or JSF. Regardless you can just delegate an area of your screen real estate to our application and populate the contents with a URL that loads up a report, a dashboard or even a screen from our portal. So that’s the recommended approach even for people who are not Microsoft shops, too.
Flaherty: Okay. And then we have two related questions, what is the upgrade path from prior versions, for example Version 8 to 11.1, and then about getting new version?
 |
Read how InetSoft was rated as a top BI vendor in G2 Crowd's user survey-based index. |
Hynson: Sure. So we have done a much better job in terms of maintaining 100% backward compatibility. Version 8 is going back quite a ways and that’s taking quite a leap skipping over like six or so intermediary versions. So one of the things to look out for is the chart engine, which was changed in Version 10. Old charts will continue to run but they would not be editable once you upgrade.
And after that, I would say follow the upgrade instructions on our community Wiki, which shows you everything that you need to know in terms of package changes. So anything beyond the simple “.jar” upgrade we will try to document so that you are aware of the other changes that you might have to make it deployed.
And if you are interested in downloading the new version, which I highly recommend, you can just log into out website at www.inetsoft.com. Log into the customer portal, and go to download. You will also need to upgrade your license keys if you are coming from a prior major version, so 8, 9, 10. And you can do so in a self-service way from that same customer portal, simply click on Upgrade My Keys and you can do that for both run time keys and your developer keys.
Flaherty: Okay. Well, we have come to the half hour, so we are going to end webinar. Now we do have some other questions that we can get to, we will answer them offline after the webinar. So thanks again everyone for attending, and have a nice weekend.
| Previous: Usage of Aggregates in a Chart |


