InetSoft Webinar: Enterprise Grade Business Intelligence Solutions
This is the continuation of the transcript of a Webinar hosted by InetSoft introducing the new features in the version 11.1 release of StyleBI. The speakers are Mark Flaherty, CMO at InetSoft, and Byron Igoe, Principal Technologist at InetSoft..
Flaherty: And then on the robust side, the business intelligence solution has been designed to be enterprise grade scalable in terms of having clustering and load balancing and all kinds of security and permission levels that are perfect for either an enterprise deployment or even SaaS based ones operating with a multi-tenancy model.
Performance is obviously a big issue, especially with the big data needs out there nowadays. And we have our own proprietary technology that aims to deliver high performance. It’s called Data Grid Cache. It’s the technology that we use for pre-caching the data when you want to fine tune performance in a dashboard or report. By default the product works in live data access mode, but we also have this other capability for caching when performance enhancement is needed.
Okay, let’s move on. This next slide is meant to give you an overview of our product offering. The flagship product of InetSoft’s is called StyleBI, and it's in all inclusive BI platform. In its foundation, you have got a strong data access engine and Data Block is one of the technologies that powers it. It's what lets you pick and choose different data fields from data sources and create complex queries and recombine data selections for reuse and sharing among the multiple and dashboard and reports.
| #1 Ranking: Read how InetSoft was rated #1 for user adoption in G2's user survey-based index | Read More |
Visualization is the term for the part of the software that delivers your dashboards and your visual analyses. And Publishing is the part of the software that delivers your traditional reporting, your paginated reporting whether it would be PDF based reporting or Web-based interactive reporting.
Okay so on to what's new in 11.1. The headline advancement is in Mobile Business Intelligence. It's been a theme that you have probably heard more and more talk about over the past year or so. And before this release you could have used our software on mobile devices that had a Flash player but now we have extended support for mobile devices that don’t have Flash players and most notably that would be your Apple devices like your iPad and your iPhone. You may be seeing in your company already the iPad particularly becoming popular. The tablet format is a very attractive way of using dashboard reports whether in meetings or out in the field.
The next advance has to do with speed of development and ease of creating your dashboards and reports. Particularly it helps doing things like percent of total calculations, things that you may have had to previously calculate or have created at the worksheet level, now these are just built in calculations that are available for you in the dashboard designer.
And then the last one of the highlights of this release to mention has to do with development environments where you have got multi-tier levels of support. If you have people who are able to make changes to dashboards, now they can easily deploy those changes to a remote server and they don’t need to have our complete Enterprise Manager application.
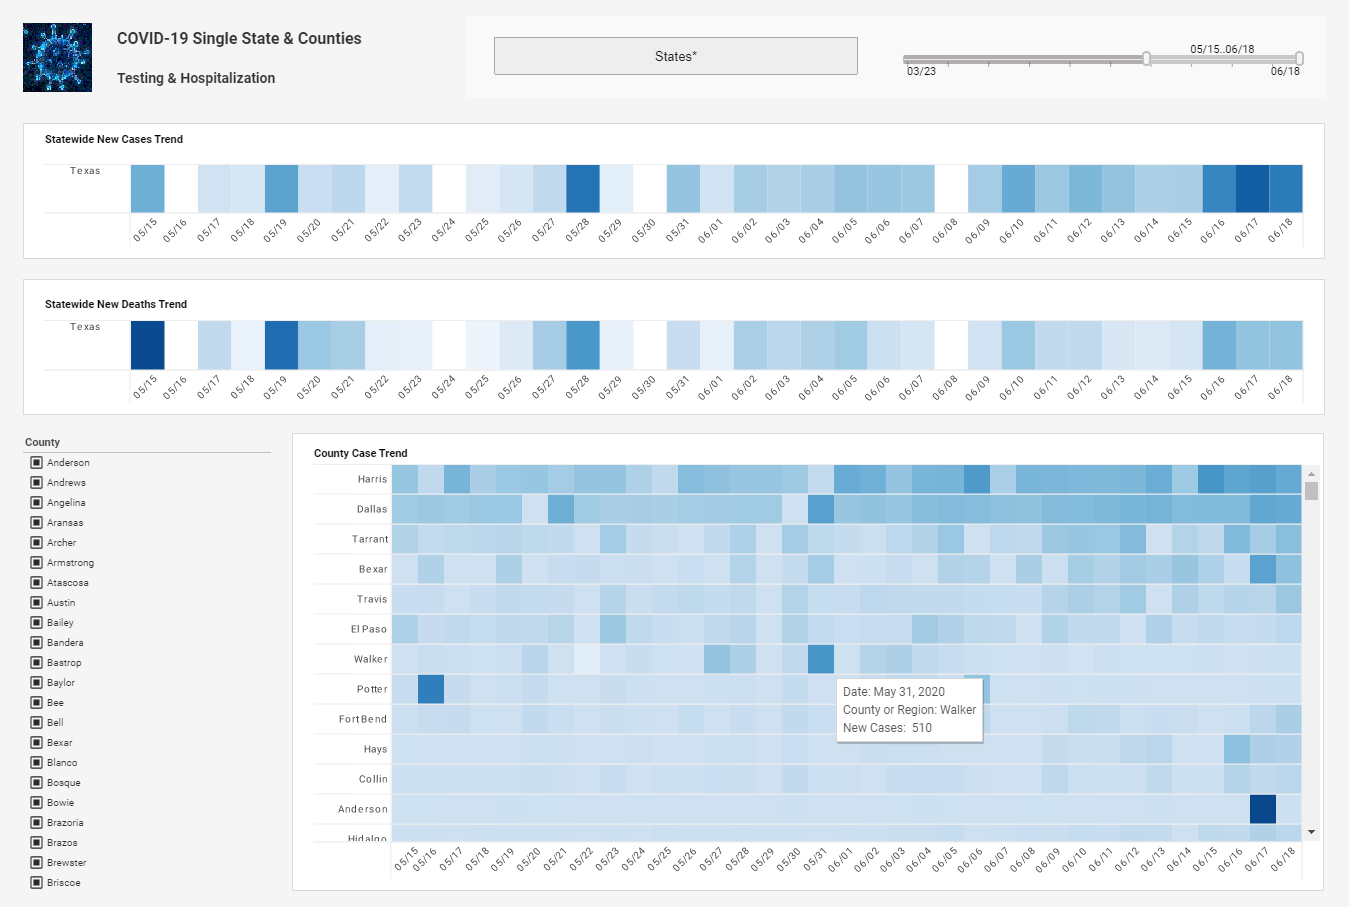
Okay now transitioning into the show and tell portion of the webinar. First for Mobile Business Intelligence here is a screenshot of a dashboard that’s running on iPad. Obviously we can describe a little more about what the capabilities are here in Mobile Business Intelligence, and so with that I am going to hand it over to Byron who is going to take us onto the show and tell portion.
Read what InetSoft customers and partners have said about their selection of Style Scope for their solution for dashboard reporting. |
Byron Igoe: Thanks, Mark. So I get to start off with the iPad side, and really there is a key change for the visualization side of things. We have always supported the reporting side on mobile devices simply using HTML and JavaScript and including testing for major browsers like Firefox, IE and even Safari.
| Previous: Advances in Mobile BI |


