InetSoft Webinar: The Evolution of New Business Intelligence Tools
This is the continuation of the transcript of a Webinar hosted by InetSoft on the topic of "Improving Business Agility Using Performance Management Software." The speaker is Mark Flaherty, CMO at InetSoft.
So in the same vein, the increasing capabilities of computation and the evolution of new business intelligence tools provide us new opportunities, great opportunities to analyze data in a complex and evolving landscape and to gain multidimensional insights into the dynamic landscape business we’re operating in. Finally, I will discuss the importance of building capacity through knowledge development that incorporates complexity to enhance the ability of the decision makers to act confidently. Okay, so what is business intelligence?
Business intelligence is a process of extracting insights from data. So as our operating definition of the topic we’re discussing, we need to discuss the components of the description. So first, insight, for our purposes, it is fundamentally distinct from information. If we can go to the next slide. We react to information but we build capacity with insight.
Then we look to data, and we have to appreciate that as well as not a static representation of information. Data has become a dynamic stream of information that results from people’s activities that can be collected in real time and over time. So for example, we just don’t look at numbers but social networks, Web transactions, POS and credit card information.
| #1 Ranking: Read how InetSoft was rated #1 for user adoption in G2's user survey-based index | Read More |
Next slide. The capacity of creating insight from data has accompanied the complexity of the environment that we find ourselves doing business in. So all types of business data are accessible thanks to the tremendous computational power present even in your laptop computer. We see people do it, developing maps and visualization tools and so on, simply on their laptops. We see rapid development of performance management tools, and methodologies for exploring relationships and properties of data within these steps. And systems are becoming more agile as BI evolves. So the pace of innovation is not slowing down but rather gearing up.
Where even 10 years ago, information was analogous to power. The information is now ubiquitous. Today, there’s a dynamic and insightful understanding of the environment we’re engaged in, and it creates advantages by virtue of the potential to reveal opportunity and to help us mitigate potential risks. We need to be sure we’re poised to exploit these opportunities and gain insights. So are we even collecting data or data that makes sense? Are we sharing? Are we able to share it? Are we using it effectively? Are we experimenting with it? Are we looking for other BI tools that might give us other insights that we hadn’t thought about as opposed to relying on what we’ve traditionally done. As the business changes, so our use of data has changed.
Where do we see companies falling short the most? Is it through the gathering of the right data and being able to store it accordingly? Is it being able to take that data in a quick and easy environment, or is it then taking data and making them actionable to form business decisions? Now, if you look at those three steps, where is the biggest gap? I actually think all of those in different ways. One thing is we don’t even collect the data because we don’t use it. Often, at times we collect data, and then we’ve so much data that we don’t necessarily know what to do with it, or we look for pieces of information that we’ve used before and we understand, as opposed to trying to find new ways to look at that information relative to other information.
 |
Learn how InetSoft's data intelligence technology is central to delivering efficient business intelligence. |
So I think it’s all of those. I think another thing is we might crunch some numbers. We want real time updates of numerical information, but there are new visualization tools that are better, simpler, that you can use to visualize data to look at it in dynamic simulations. Predictive modeling is now more common. So there’s all kinds of BI tools that we can use, but many of us end up turning to very costly, expensive solutions. We hire consultants, but we’re not necessarily looking for the information but hoping somebody will give us the answers. So we’re not looking to discover insights but rather seeking more information.
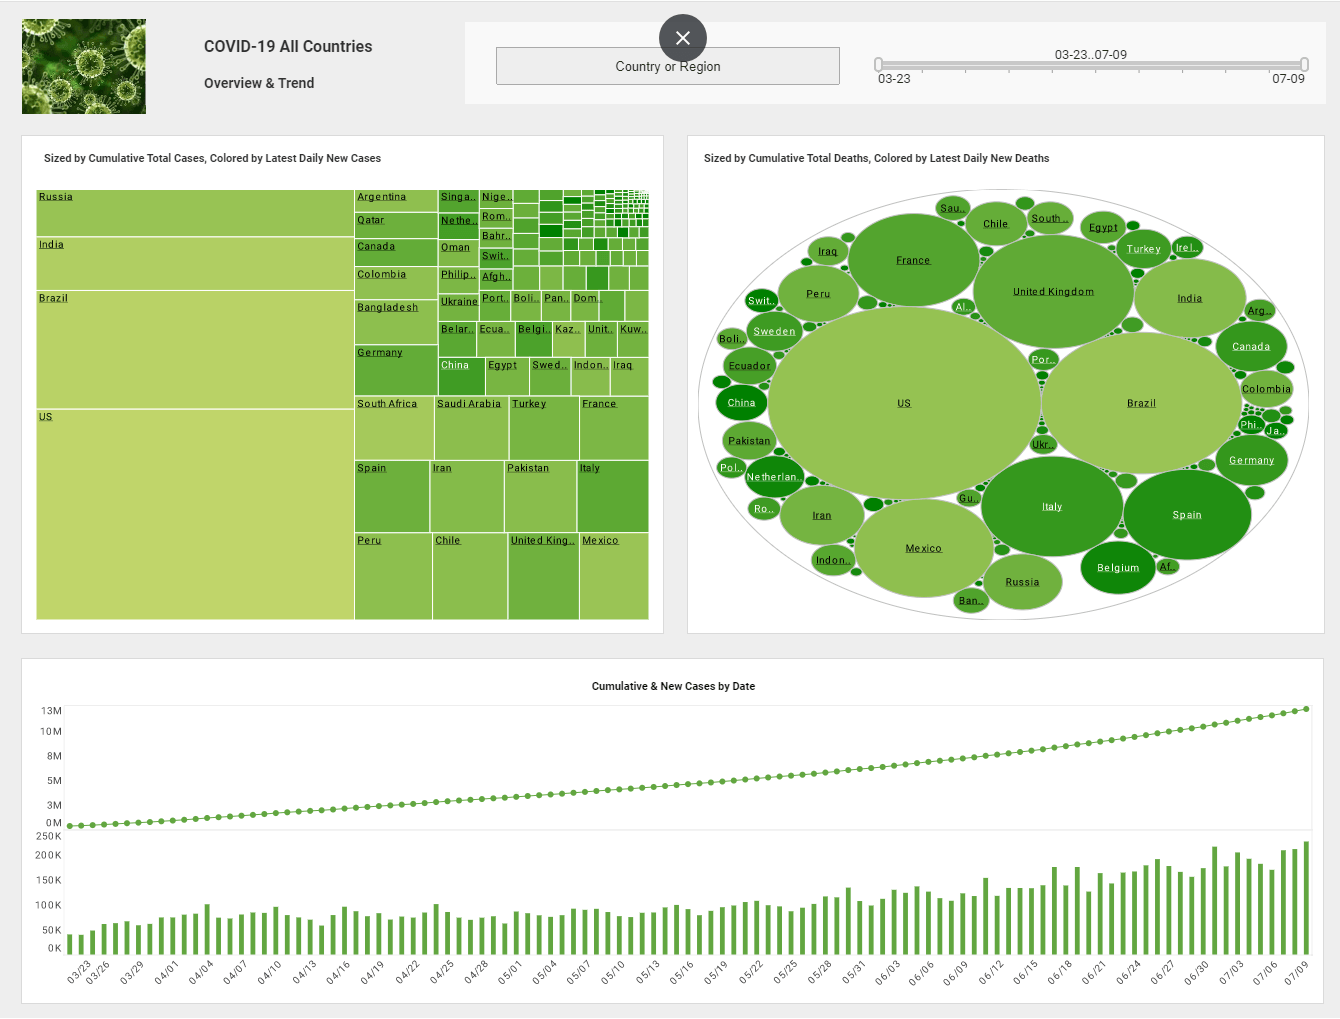
So you have to ask yourself, are you poised to exploit opportunities? So as we said, you know, data analysis is increasingly accessible for everybody. There are opportunities in the cloud, the explosion of data visualization tools for exploring data in new forms. Here’s an example of a quick visual transformation that starts with some dimensions in a static format, static information. So if you take a spreadsheet for example, and you look at it, and you use a mapping tool, so you can see things that are dimensions in this raw information, but you wouldn’t have seen that by just looking at the spreadsheet.
| Previous: The Path to Business Agility Success |


