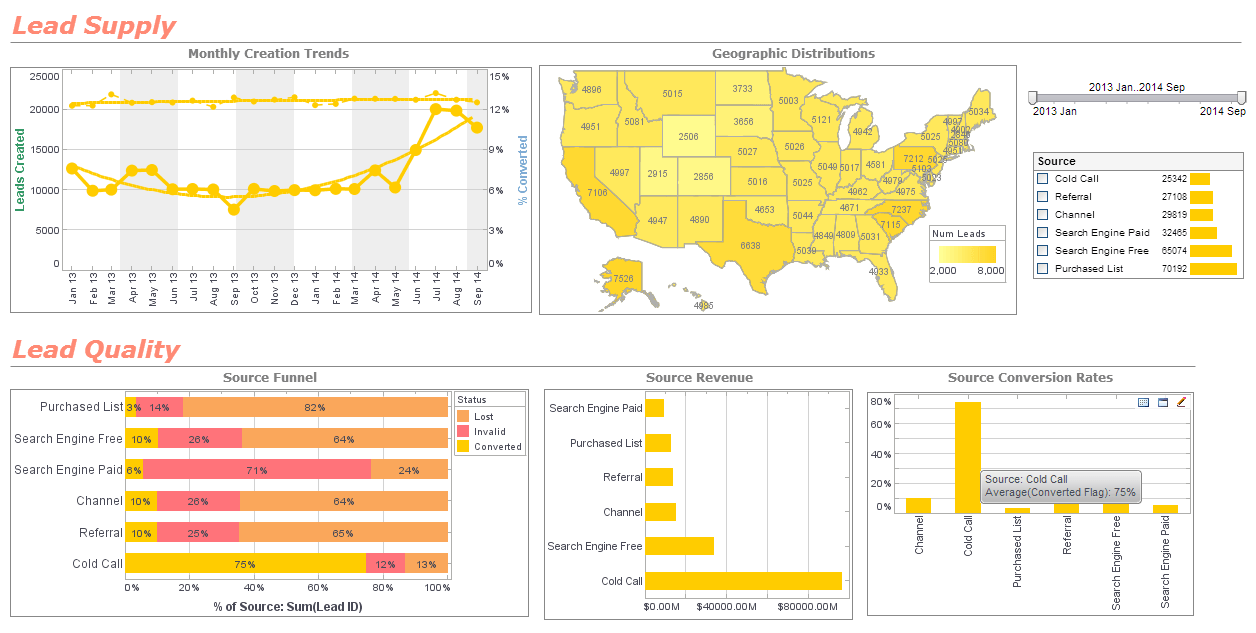
InetSoft Webinar: An Example for Marketing Analysis
This is the continuation of the transcript of a Webinar hosted by InetSoft on the topic of "The Changing Requirements of Business Intelligence." The speaker is Mark Flaherty, CMO at InetSoft.
The second example was for marketing analysis in the field for very large automobile manufacturer. Their big objective as a company was to change their relationships with the dealers. Become more consultative with the dealers, more consultative in terms of what’s selling, what kinds of promotions work on which vehicles. Going down to the vehicle level, in fact even down to the version of those vehicles, including discounts on after market parts.
The company wanted to push profit and loss responsibility down to the regional level and to do that the company had to provide regional sales managers with much greater visibility and much greater ability to explore their data. Sales reps and managers are able to quickly ask entirely new questions with an interface that has this walkup usability, and it actually gives them a greater ability to consult with the folks who run the dealerships themselves.
| #1 Ranking: Read how InetSoft was rated #1 for user adoption in G2's user survey-based index | Read More |
We did a similar thing with another customer, a company that sells seeds, many different kinds of seeds. They have different properties engineered into the seeds, and this company uses test beds all over the country so that they can get really good data on the yield that different kinds of seed produce in different kinds of soil at different kinds of latitude. The sales people for this company now go out to farmers and have to be able to demonstrate we can improve your yield. Farmers very practical people ,and these folks from the seed company need to be able to tell a clear story about the improvement that would accrue to those farmers if they use the different kind of seed, and it still has to have consumer ease of use.
The third and last example comes from a large consumer package goods company. Here the problem we had was that we had to find out why is there is a difference, why is there a variance between the forecast of what we believe we should ship to various different retail points and what we actually ship? What is the cost of the variance? This particular customer had BI platforms for reporting, for dashboards, even for statistical analysis, but the the reason they went with InetSoft was the data mashup capability. None of the other tools was able to unify their data in a single view. Now they could ask all kinds of new questions. Did we run a promotion that the demand planners didn’t know about and so therefore was it reflected in the forecast? Well, let’s bring in this promotion database out of marketing. Did our competitors change their price in that region? Let’s bring in the consumer data provided by a third party provider which we buy every month. Let’s integrate that in.
 |
Read the top 10 reasons for selecting InetSoft as your BI partner. |
The company had never seen the data resources integrated together before, and it led them to ask them all kinds of new questions from new perspectives. They got a new level of agility. Talking again about the tension between business and IT, business is saying we have to have better visibility. We have to have better ability to choose the way we look at the data. IT is bending over backwards to provide a really high level of service to the business, but they are facing a new challenge. They are facing a challenge of diversity of scale, diversity in the data, diversity in the questions, and the answer is agility. The ability to reduce the cost of getting fast answers to new questions takes a new approach to data and a new approach to these experiences and new approach to deployment.
| Previous: The Answer Is Data Mashup |


