Human Resources Dashboards
The human resources department manages the most important asset of any organization. In order to attract and train new hires and retain productive employees, HR professionals must take full advantage of treasure hidden inside their data.
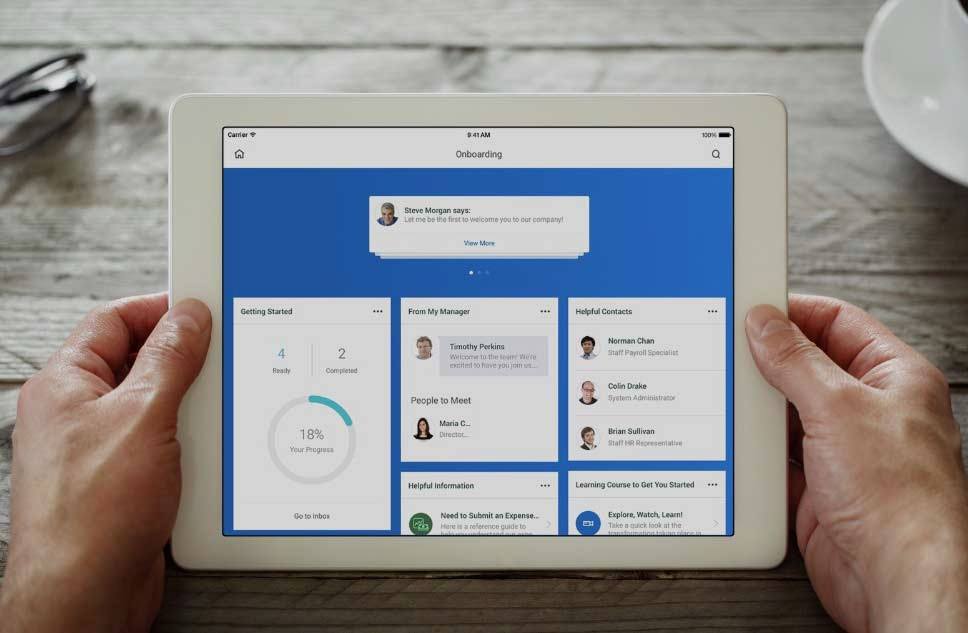
Interactive and Customizable HR Dashboards
InetSoft's rich interactivity and customization empowers every HR user with self-service analytics that require zero training. These self-service functions allow every user to answer one-off or any unanticipated questions. The freedom to explore data opens the door for all HR professionals to become data-based innovators.
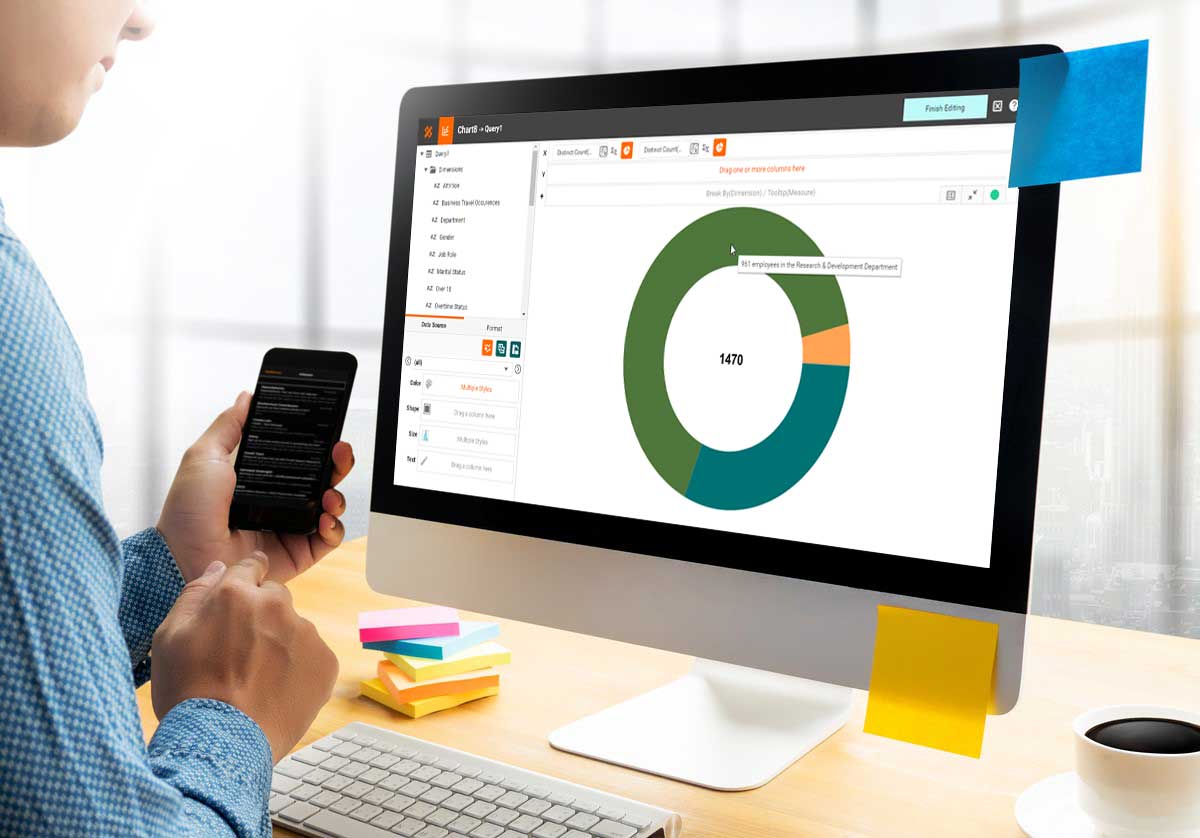
Self-Service Visualizations for HRMS Dashboards
InetSoft's analytic web app enables data-oriented HR professionals to self-serve their data intelligence needs. The web app combines data mashup with visualization into an intuitive process. It can mashup data from enterprise databases with ad hoc Excel spreadsheets and instantly turn the result into visual dashboards.
What Kinds of Visual Analytics Does an HR Professional Do?
Human resources (HR) professionals utilize visual analytics to gain insights into various aspects of workforce management, employee engagement, performance, and organizational health. Visual analytics tools help HR professionals to analyze and communicate complex data in a visual format, enabling better decision-making and strategic planning. Some companies use Find HR Software to select a solution with built-in dashboards. Others choose InetSoft and customize their dashboards. Here are several types of visual analytics commonly used by HR professionals:
-
Employee Demographics: HR professionals use visual analytics to analyze and visualize employee demographics such as age, gender, ethnicity, education level, and tenure. Visual representations like pie charts, bar graphs, or heat maps can provide insights into the diversity, composition, and distribution of the workforce, helping HR teams identify trends, disparities, and areas for improvement in diversity and inclusion initiatives.
-
Recruitment and Hiring Metrics: Visual analytics can help HR professionals track recruitment and hiring metrics such as time-to-fill, cost-per-hire, source of hire, applicant demographics, and recruitment funnel effectiveness. Dashboards and reports with visualizations like funnel charts, recruitment pipelines, and geographic heat maps enable HR teams to assess the efficiency and effectiveness of their recruitment efforts, identify bottlenecks, and make data-driven decisions to optimize the hiring process.
-
Employee Performance and Productivity: Visual analytics tools enable HR professionals to analyze employee performance metrics, including key performance indicators (KPIs), goal attainment, performance ratings, and productivity metrics. Line charts, scatter plots, and histograms can visualize trends over time, identify high-performing individuals or teams, and pinpoint areas where performance improvement or intervention may be needed.
-
Employee Engagement and Satisfaction: HR professionals use visual analytics to measure and track employee engagement and satisfaction levels through surveys, feedback mechanisms, and sentiment analysis. Visualizations such as stacked bar charts, word clouds, and sentiment analysis dashboards help HR teams identify drivers of engagement, areas of concern, and trends in employee sentiment across different demographics or departments.
-
Training and Development Analytics: Visual analytics tools are employed to track and analyze training and development initiatives, including training completion rates, skill acquisition, competency gaps, and learning outcomes. Tree maps, bubble charts, and skill matrix heat maps can visualize training effectiveness, identify skill deficiencies, and inform workforce development strategies to address skill gaps and support career growth.
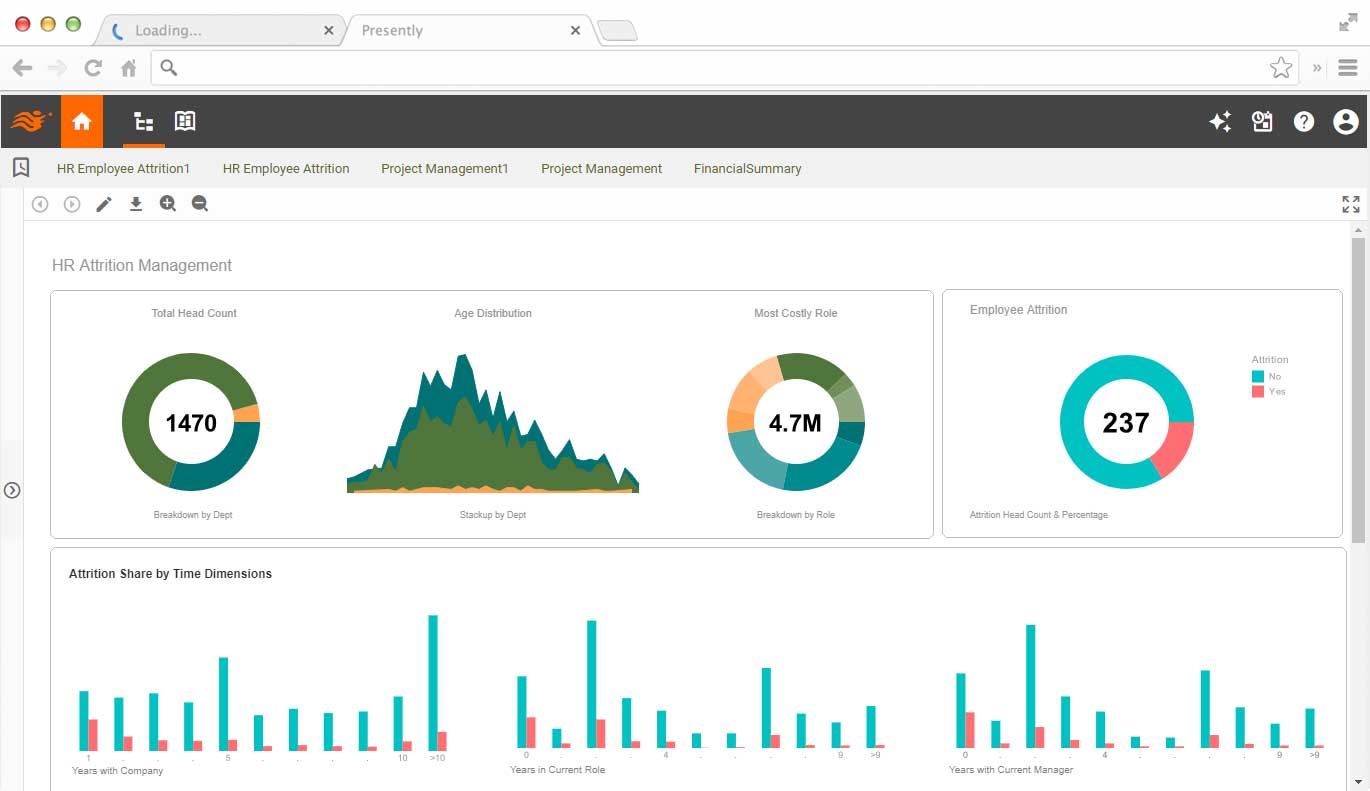
-
Turnover and Retention Analysis: HR professionals use visual analytics to analyze turnover rates, retention patterns, and reasons for employee attrition. Flow diagrams, churn analysis dashboards, and survival curves can visualize employee movement within the organization, identify turnover hotspots, and highlight factors contributing to voluntary or involuntary turnover, enabling HR teams to develop targeted retention strategies.
-
Workforce Planning and Succession Management: Visual analytics supports workforce planning and succession management by providing insights into workforce demographics, skills inventory, talent pipelines, and succession readiness. Organizational charts, skill matrices, and succession planning dashboards help HR professionals identify high-potential employees, assess succession risks, and develop talent development plans to ensure a pipeline of future leaders.