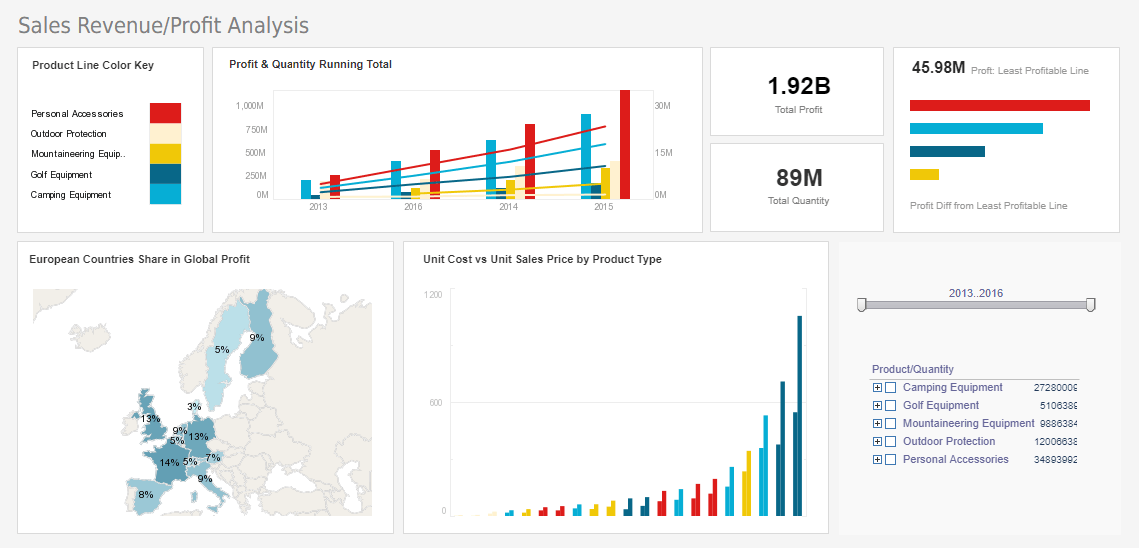
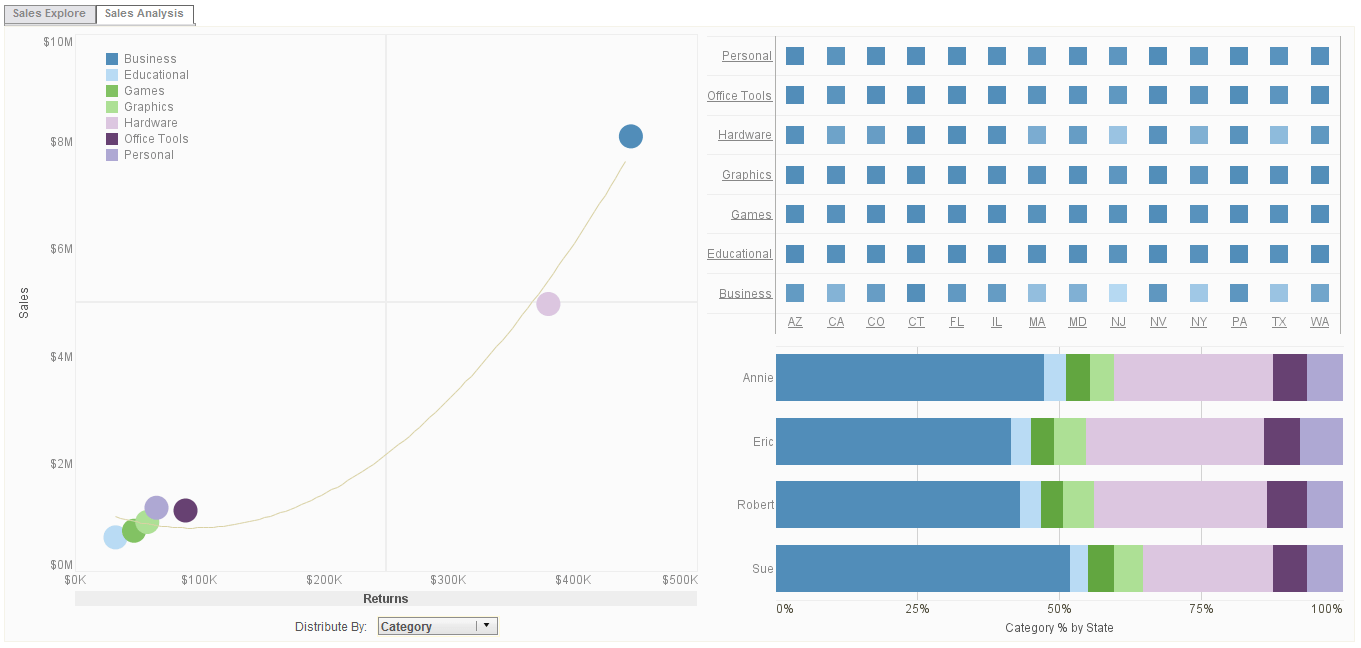
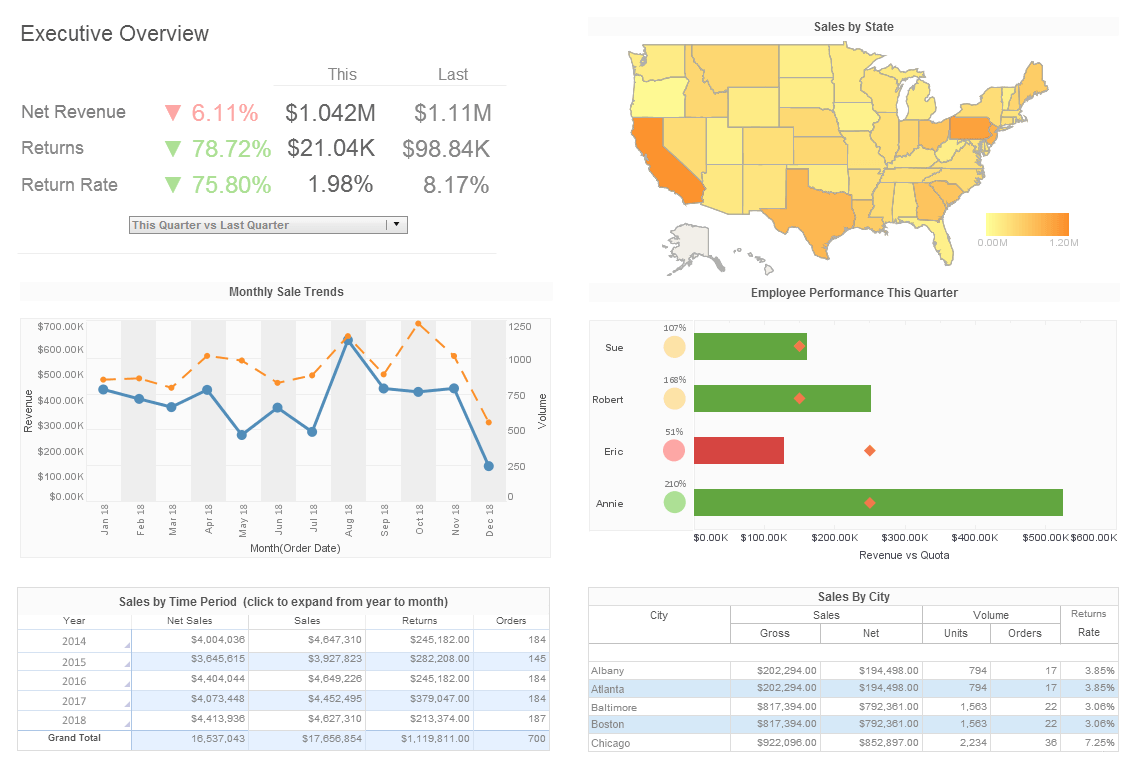
Looking for Integrated, Interactive Sales Dashboards?
InetSoft offers a unique dashboard system that can be easily integrated across multiple platforms. InetSoft's software can help you seamlessly pull data from different data sources regardless of the format, source, or platform, so that you can create integrated reports and dashboards.
You can also easily integrate InetSoft's programming components into your own unique application at many different levels to offer your own custom-built solution online, customize the built-in portal, and pass credentials directly from your application to the StyleBI framework for single sign-on.
Integrating different data sources is becoming increasingly important, and almost a necessity in today�s business world. With InetSoft's integrative capabilities across multiple platforms and data combinations, you are able to create a clear, concise view of your own business which will deliver actionable insights to users in just a matter of minutes.
And by getting what you need in just minutes, not days, you can make monumental decreases in administrative costs. As an example of this kind of advantage, companies that have integrated sales and marketing dashboards together have reported a 67% decrease in administrative costs and improvements in on-time shipping, and there are many areas of business that are improved as a whole.


Improve Sales Productivity with Comprehensive Reporting
Data visualizations which convey key sales performance indicators in an intuitive way are a key for a sales team. By integrating different data sources within the InetSoft platform you get a means to easily create effective data visualizations which feature data from all of your organizations preferred sources. Data-modeling is made simple with drag and drop functions to easily combine fields from disparate data sources without having to create an actual combined data source.
This ensures that even the least knowledgeable business users can create complete and informative data visualizations in a hands-on and intuitive way, and can quickly understand share this information with others. All the while, users have complete flexibility in report design and generation.
InetSoft's technology offers strong capabilities in collaboration and exploration, using HTML5-based technology to simplify user interaction. So you not only can easily integrate data from different sources into meaningful reports and visual analyses, but you can also derive meaning from those reports through sharing with others and easily make the information accessible across your entire business.
By using a system which integrates all of your data sources, you can drill through comprehensive dashboards to get answers, within just a few clicks. Non-integrated solutions could force you to use two or more applications, and take more time and resources to derive valuable insights as a result.
Creating an integrated sales dashboard system for your team prevents you from having to pick out information from distinct data sources, and overall leads to quicker decision making and greater ease of use.
About InetSoft
Since 1996 InetSoft has been delivering easy, agile, and robust business intelligence software that makes it possible for organizations and solution providers of all sizes to deploy or embed full-featugored business intelligence solutions. Application highlights include visually-compelling and interactive dashboards that ensure greater end-user adoption plus pixel-perfect report generation, scheduling, and bursting.
InetSoft's patent pending Data Block™ technology enables productive reuse of queries and a unique capability for end-user defined data mashup. This capability combined with efficient information access enabled by InetSoft's visual analysis technologies allows maximum self-service that benefits the average business user, the IT administrator, and the developer. InetSoft solutions have been deployed at over 5,000 organizations worldwide, including 25% of Fortune 500 companies, spanning all types of industries.


