Intranet Dashboards
What is an Intranet Dashboard? Examples of Intranet Dashboards How to Create an Intranet Dashboard Using an Intranet Dashboard
What is an Intranet Dashboard?
An intranet dashboard is a digital tool for displaying critical data to company employees in a manner that is accessible at all times and on all devices. The data displayed by the intranet dashboard should be tailored to the user accessing it.
- For example, for the CEO, the intranet dashboard may display executive KPIs such as monthly revenue, major sales, staffing levels, as well as project timelines, upcoming conference calls, and so on.
- For an engineer, the intranet dashboard may display status of team members, hours worked per project, progress toward targets, as well as personal information such as salary, expenses reported, vacation days, etc.
- For a salesperson, the dashboard will display CRM information about the sales channel such as opportunities, prospects, and closed sales, as well as personal sales numbers.
- For managers, the intranet dashboard will display performance, availability, and assignments for all team employees.
Of course, intranet dashboards must be able to work efficiently with existing organizational security and data governance practices to ensure that privacy and data integrity are ensured.
Examples of Intranet Dashboards
The following sections provide some examples of intranet dashboards for different industries.Insurance Industry
An insurance claims manager should be able to view all relevant claims, payment amounts, status of claim, and client information on a single dashboard, and should be able to access this information both from the office and the field. The insurance intranet dashboard should facilitate the drill down to all levels of detail, from status of individual payments to claims documentation to benefits provided, such as rental cars or medical aids. The agent should effortlessly be able to filter the dashboard to see exactly the data they need at the moment, both to assist their clients and to monitor their own job performance. Managers should be able to see data both of individual team members and aggregates across the department to be able to understand and improve the performance of all team assets.


Call Center
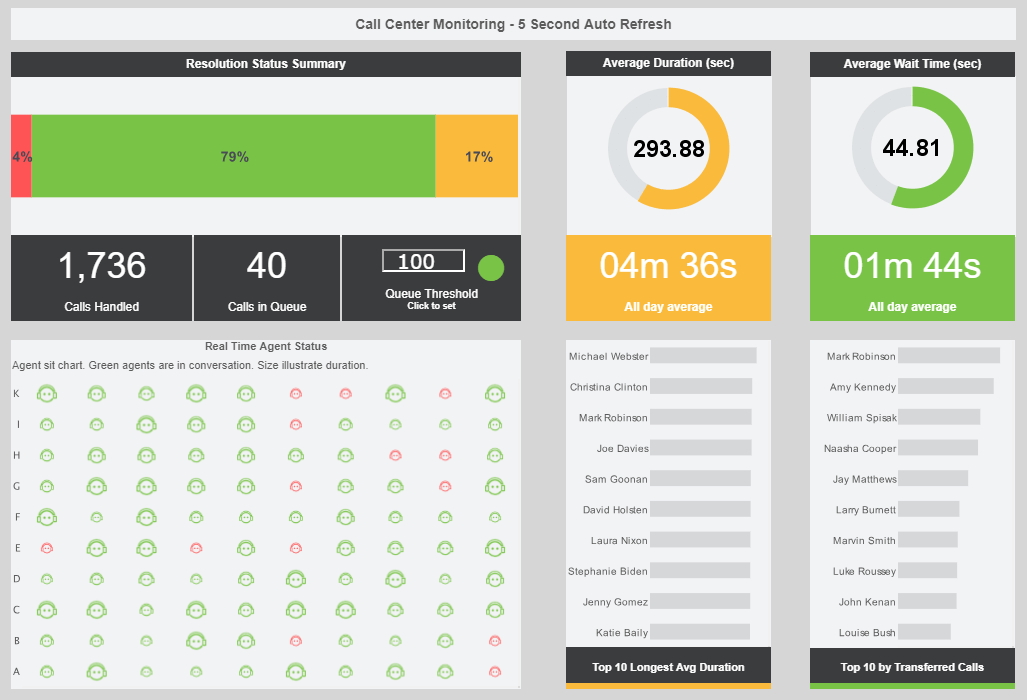
Call center managers need to have instant access to the current state of engagement for any teams they supervise, including calls whose duration might indicate a developing issue requiring escalation. Managers should be able to filter by such parameters as call length, queue length, wait time, and should be able to drill down to view individual agent's communications metadata. Ideally, the call center intranet dashboard should also trigger on-screen and email alerts when certain thresholds are crossed, such as undesirable wait times or call terminations caused by call surges that might require the manager to reallocate resources. Dashboards should provide an option to contact team members via chat or email so that assignments of staff to calls can be made seamlessly and quickly.
Law Practice
Partners, associates, and staff in a legal practice need to keep close track of cases and staffing as matters move through different stages of litigation or negotiation. An intranet dashboard can present a simplified view of the current state of the practice, both from a legal perspective and a human resources angle. The law firm intranet dashboard will enable individual attorneys to track billing and the status of matters on which they are providing counsel, and will allow partners and managers to oversee the direction and evolution of the firm as a whole by viewing results of attorneys on staff and business lost to competitors. The intranet dashboard will help keep all staff fully informed of key deadlines and deliverables, so that the business end runs smoothly and clients’ expectations are met and exceeded.


Sales and Marketing
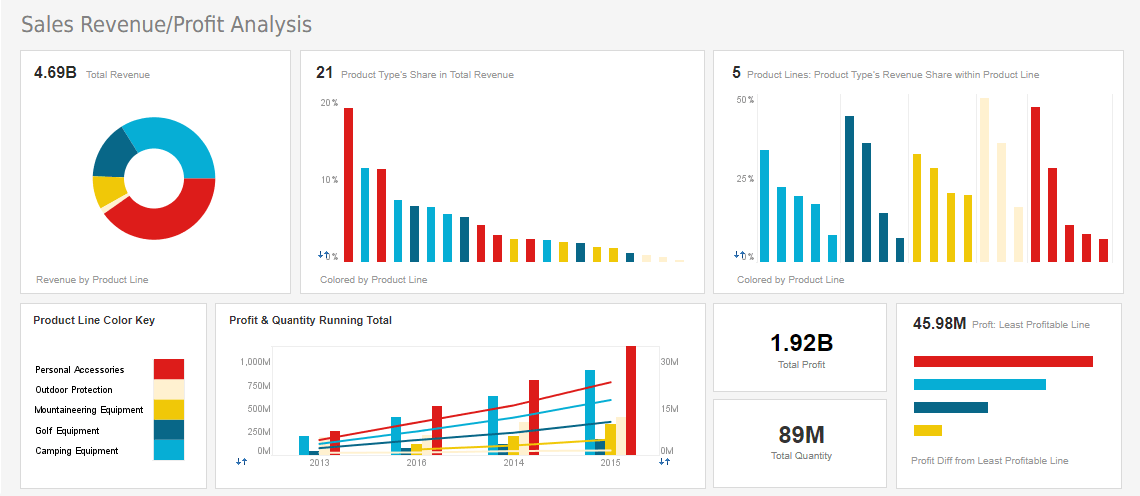
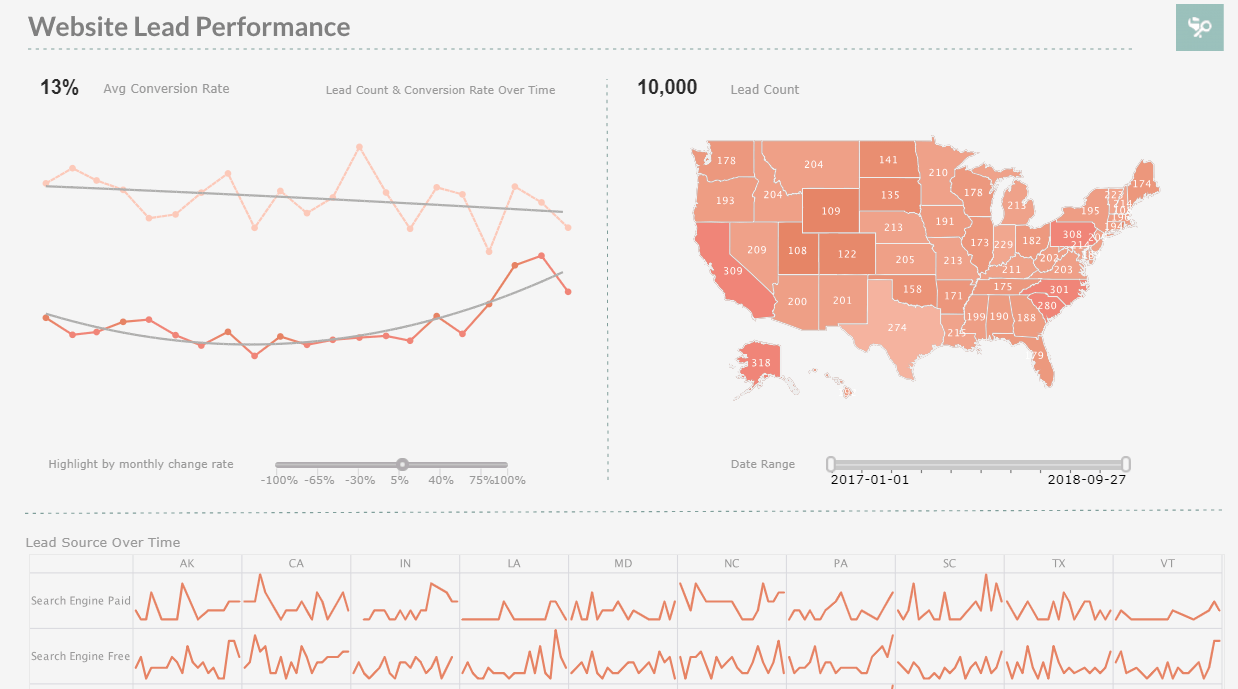
Among the most applications for intranet dashboards is sales and marketing. Intranet dashboards for sales and marketing operations should allow agents and managers to instantly see existing sales, prospects, customer engagements, travel, conferences, and other aspects of the sales and marketing process. Representatives who travel or work remotely will find it especially productive to have an intranet dashboard as “home base” to keep them connected to their team and the larger organization.
Maintenance
Maintenance departments can greatly benefit from intranet dashboards. Dashboards allow team members to have access to maintenance data from any physical location and any device. Dashboards can be used to keep all members apprised of current work order status, provide alerts for delayed projects and parts deliveries, and aid in coordinating smooth collaboration between different maintenance teams. Dashboards can be used to send out updates and alerts to make sure that no scheduled items are overlooked.

Using an Intranet Dashboard
InetSoft intranet dashboards are easy to use and provide a wide number of features to promote knowledge dissemination and collaboration in your organization. Built-in drill down and hylinking features allow users to quickly access all levels of data, from high-level summary to raw data. Extensive filtering capability enables users to create different views of the data to gain an understanding of their project or task. Database write-back facilitates the entry of new data, allowing users to add or update data in central data stores.
Device-specific layout makes it possible to intelligently adapt dashboards to any device that staff or agents may be using, whether laptop, tablet, or phone. Extensive collaboration and distribution options include email, social media, export, and print, batch scheduling, bookmarking, and annotation. Finally, security is built into InetSoft dashboards at the very core; Data, assets, operation security can be managed at a fine level based on user, group, or role, to ensure data integrity. A fully scriptable environment additionally provides the implementation of custom business logic and integration with other intranet frameworks.