Software for Automating Marketing Reports
Marketing departments often start off creating their own weekly and monthly reports using Excel and PowerPoint. Eventually this consumes one person's one full day per week. The process is error-prone, and if the person is out sick or leaves the company, then real problems arise.
The solution is to invest in software that automates the process, querying any of the necessary mrarketing data sources such as Google Analytics, Ads, Twitter, Facebook, LinkedIn, Hubspot, salesforce.com, or an internal CRM system.
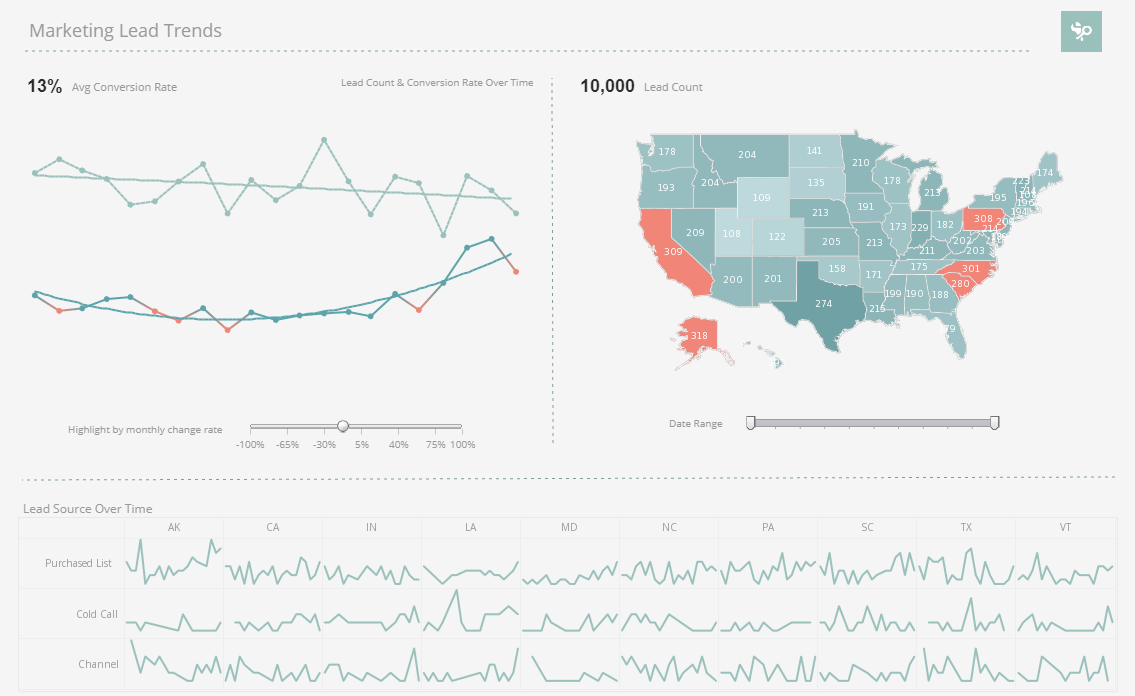
Design interactive dashboards like the example here, or static paginated reports to distribute to senior leadership or external clients. InetSoft offers the BI tool that you can use to automate all of these. Be up and running in a couple of weeks with mentoring from a dedicated InetSoft expert.
What Are the Steps to Automate Marketing Reports?
Here's a step-by-step guide to help you begin automating your marketing reports:
-
Define Your Reporting Objectives: Determine the key performance indicators (KPIs) and metrics that are crucial for your marketing efforts. Identify what data you want to include in your reports and the frequency of reporting (e.g., weekly, monthly, quarterly).
-
Choose the Right Tools: There are various marketing automation and reporting tools available in the market. Select a tool that aligns with your reporting needs and integrates well with your existing marketing platforms (e.g., Google Analytics, social media platforms, email marketing tools).
-
Data Collection and Integration: Ensure that all the relevant data sources are integrated into your reporting tool. This may require setting up API connections or data exports from your marketing platforms to the reporting tool.
-
Data Cleaning and Transformation: Before generating reports, clean and preprocess the data to remove any discrepancies, duplicates, or irrelevant information. Transformation may involve converting data into a standardized format for easier analysis.
-
Create Report Templates: Design visually appealing and informative report templates that suit your reporting needs. Incorporate charts, graphs, and tables to present data effectively. Most reporting tools offer customizable templates for this purpose.
#1 Ranking: Read how InetSoft was rated #1 for user adoption in G2's user survey-based index Read More
-
Schedule Automated Reporting: Set up a schedule for automated report generation. Depending on your requirements, reports can be generated daily, weekly, monthly, or on-demand. Automate the distribution of these reports to relevant stakeholders via email or a shared drive.
-
Implement Data Security: If your reports contain sensitive data, ensure proper data security measures are in place to safeguard information from unauthorized access.
-
Test and Validate: Before fully deploying automated reports, thoroughly test the process to ensure the accuracy of data and that the reports are being generated as expected.
-
Monitor and Optimize: Regularly monitor the automated reports to identify any issues or discrepancies. Continuously optimize your reporting process based on feedback and changing reporting needs.
-
Integrate Insights and Actions: The purpose of automation is not just to generate reports but also to provide valuable insights. Use the data from the reports to inform marketing strategies and make data-driven decisions.
What Are the Features of a Good Automated Market Report Solution?
-
Data Aggregation: The solution should be capable of gathering and consolidating data from various reliable sources. This includes real-time market data, historical trends, and relevant industry news.
-
Customization Options: Users should have the flexibility to customize the reports to meet their specific needs. This could include selecting data parameters, timeframes, chart types, and other relevant variables.
-
Real-time Updates: Timely information is critical for market analysis. The solution should offer real-time or near-real-time data updates to keep users informed about the latest market developments.
-
Visualization Tools: Clear and insightful data visualization is essential for understanding market trends at a glance. The solution should offer various charts, graphs, and other visualization options to present data in a user-friendly manner.
-
Comprehensive Analysis: The solution should provide in-depth market analysis, not just raw data. This might include trend analysis, performance comparisons, market sentiment analysis, and other valuable insights.
-
Automation and Scheduling: The ability to automate report generation and scheduling is a must. Users should be able to set up regular reports to be delivered at specific intervals (e.g., daily, weekly, monthly).
-
User-Friendly Interface: The platform should have an intuitive and easy-to-navigate interface. Non-technical users should be able to access and understand the data without requiring advanced data analysis skills.
-
Data Security: As market data can be sensitive and valuable, the solution should have robust security measures in place to protect user data and ensure privacy.
-
Mobile Compatibility: With the increasing use of mobile devices, the solution should be accessible and optimized for mobile platforms, enabling users to access reports on the go.
-
Integration Capabilities: Ideally, the automated market report solution should seamlessly integrate with other tools and platforms commonly used in the industry, such as CRM systems or investment analysis software.
-
Scalability: The solution should be capable of handling large volumes of data and user demands without sacrificing performance.
-
Customer Support: A reliable support team or resources should be available to assist users in case of any issues or questions regarding the solution.
-
Affordability: The pricing model should align with the value provided, making the solution accessible to businesses of different sizes.
 |
Read how InetSoft saves money and resources with deployment flexibility. |

