InetSoft Webcast: What Is the New Model for Business Intelligence?
This is the continuation of the transcript of a Webcast hosted by InetSoft on the topic of "Faster Business Intelligence: Visual Reporting" The speaker is Mark Flaherty, CMO at InetSoft.
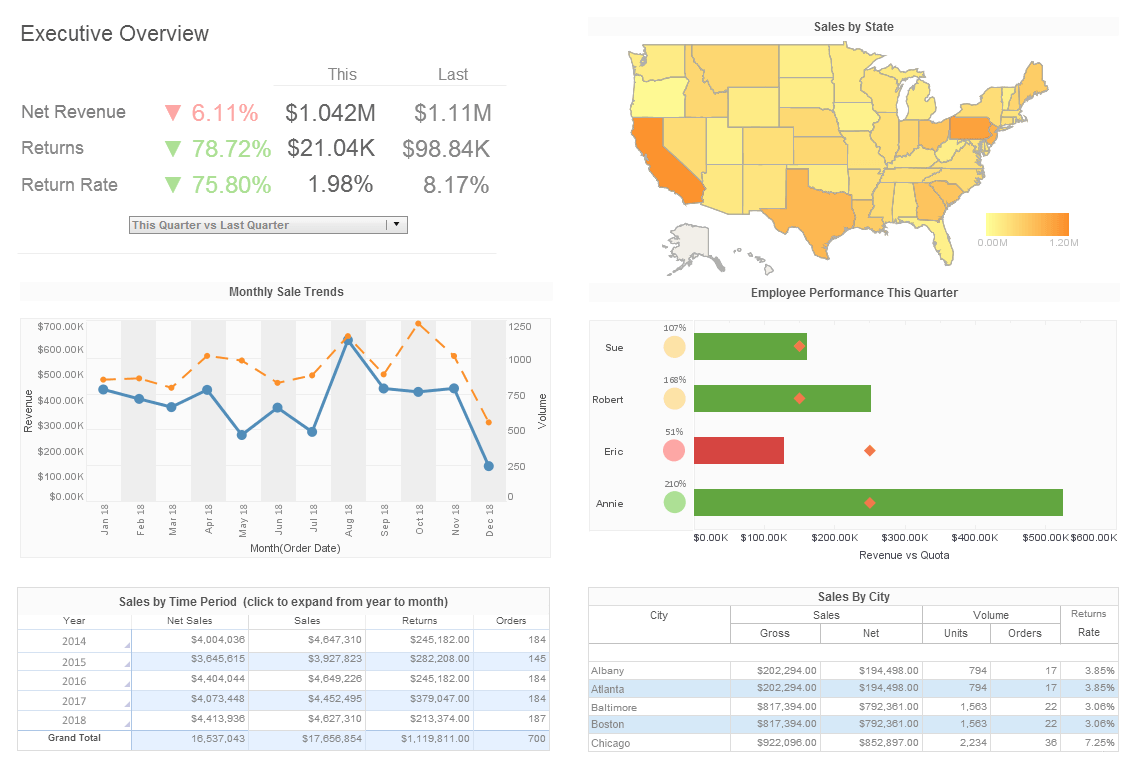
And these two paradigms have been the model for business intelligence for last 15 years, so not new at all. But we see their time ending, and it’s ending very rapidly, and it's ending right now. And what they are giving way to is a new visual analysis model, where business people can find much greater insight in the amount of time they are looking at the data. Just by organizing it better, organizing data visually and letting them interact with it visually, it ends up conveying insights and answers and not just facts.
So if we see people using published reports or OLAP reports two or three years from now, I will be very, very surprised. I think dashboards, the new style of dashboards and this new style of ad hoc analysis is going to become the predominant model for BI.
So InetSoft is involved in all of these major sea changes. It’s our fervent goal to make sure that our customers flourish and profit from these transitions. We want our customers to be the first and the best in their industries at taking advantage of these changes and to do that through our dashboard reporting software.
| #1 Ranking: Read how InetSoft was rated #1 for user adoption in G2's user survey-based index | Read More |
Our latest release of StyleBI, our flagship BI platform, offers a new paradigm for conducting data analysis that is much faster than traditional BI. The two main benefits are one, StyleBI empowers business people to get answers they need on their own, aka self-service BI, and two, business people can get their answers quickly usually in under 30 minutes. The number one request we hear from business people is that they need a way to get their answers faster. StyleBI can provide answers a 100 times faster than traditional BI by reducing or eliminating the need for support from your information technology group.
Consider that traditional BI design process of defining requirements, engineering the data, architecting the data, designing initial reports, refining those reports and finally discovering insights or getting your answers it can take many days, even weeks. With StyleBI, you can go from data to insight in less than 30 minutes. The business person can upload their own personal data or point to already existing data, and without help whatsoever from IT they can discover insights and get the answers they need.
Get Business Answers Immediately
There are four reasons why StyleBI will change the way you get the business answers you want immediately. First, the data is presented in a highly visual way. It is very easy for you to get your own answers. Two, it’s powerful and simple. You really don’t need IT anymore to get the information you need. Three, is about analyzing all of the data; some of it can be in corporate databases, but some of it can be personal or external. Business people tell us they have spreadsheets of data they want to analyze, but Excel is just not sufficient to do the job. Now with StyleBI you can get those answers you need. And four, once you have discovered the answers, you can save and share them with your colleague. With the information being so visually appealing, the data is easier to understand so everyone can benefit.
Let's take a look at some examples to help illustrate what StyleBI can do. Here you see a graph matrix data visualization which shows 80 separate graphs. This allows you to compare data side by side on one page. Each square of the graph matrix is an individual scatter plot. Each dot represents a slot machine from a casino, and the position in the square determines how much money it is making with the upper right corner being the best.
This multidimensional analysis example shows how easily we can spot outliers or underperformers visually even from very large volumes of data. This would be very difficult to accomplish with traditional BI tools using tables of data.
| Previous: Business Intelligence Platform Delivers Higher Query Performance | Next: Visual Analysis Example Using Airline Performance Data |


