Online Data Visualizer
With the use of an online data visualizer, you can transform your raw data into visualizations that are not only easy to understand, but also much more efficient for the entire business.
Raw data in its natural form is hard to make sense of. Looking at straight numbers it is difficult to see trends or areas that are missing certain goals. However, add visualizations to this data and decision-making becomes a much easier task for all company members.
With an online data visualizer, not only can data be made sense of faster, but correlations between data can be spotted and future trends can even be predicted easily with just a single glance.
InetSoft's online data visualizer allows both business and casual users to deploy professional dashboards and visualizations with no technical skill required. With InetSoft's user friendly interface, any user with a basic understanding of Microsoft Excel can deploy the data visualizer in just a few simple clicks.
Evaluate InetSoft's online data visualization software!
| #1 Ranking: Read how InetSoft was rated #1 for user adoption in G2's user survey-based index | Read More |

Online Data Access
With InetSoft's 100% web-based infrastructure data access and visualization happens in real time, meaning that users always have access to the most up-to-date data. This allows users to have the ability to create dashboards that not only meet the current needs of any business, but can also adapt to changing needs at any time.
InetSoft's real time online data visualization creates the best possible user experience by offering virtually zero lag time in loading data sets by using various techniques on large sets of data such as caching, materialized views and pre aggregation. Data caching can even be set for specific intervals of time in accordance to the user's needs so that updated data is always available when necessary. This allows users to load and process their data efficiently so that visualizations can be manipulated and transformed in real time.
Interactive Visualizer
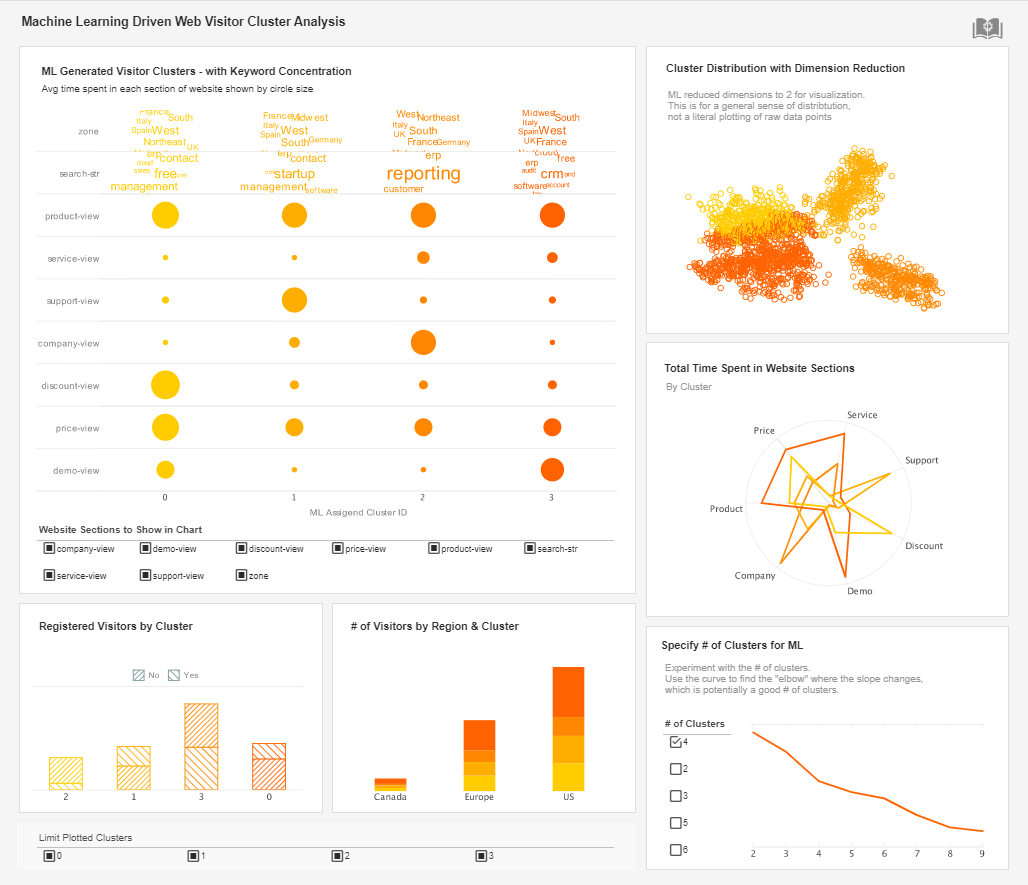
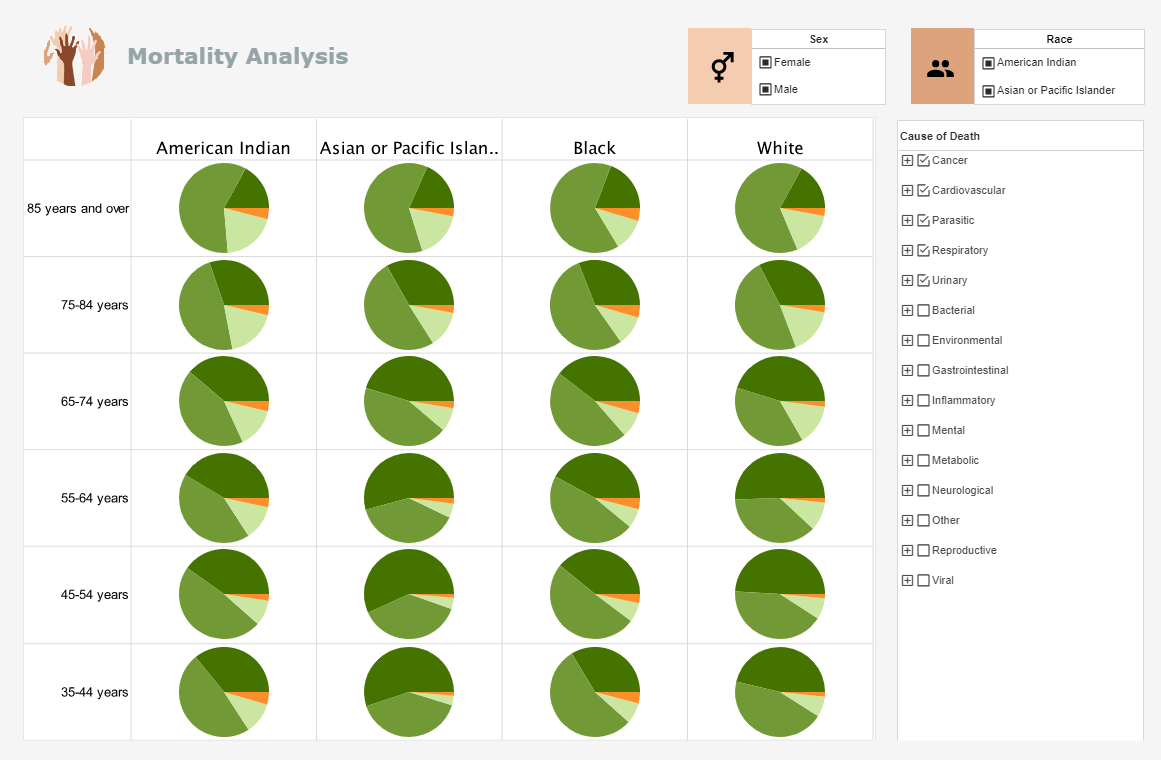
InetSoft's online data visualizer stands apart from the rest with the flexibility and interactivity that is offered to users. Not only can dashboards be created using a simple drag and drop interface, but interactive features allow users to drill down and explore data more than ever before. Users can brush, highlight, and isolate data in order to highlight relevant information that can lead to a new discovery of trends that could not be seen before when looking at raw data.
When interacting with visualizations, if users find a significant trend or piece of information they can bookmark their explorations on the dashboard and share it with other members within the business, allowing for maximum collaboration. With more non technical users able to view and interact with the data, there are more possibilities of spotting important trends or discrepancies within the data, leading to much more efficient decision making.
Interested in finding out how online data visualization tools can help your business? Request a personalized demo of InetSoft's award-winning technology today!


