Self-Service Project Management Dashboards
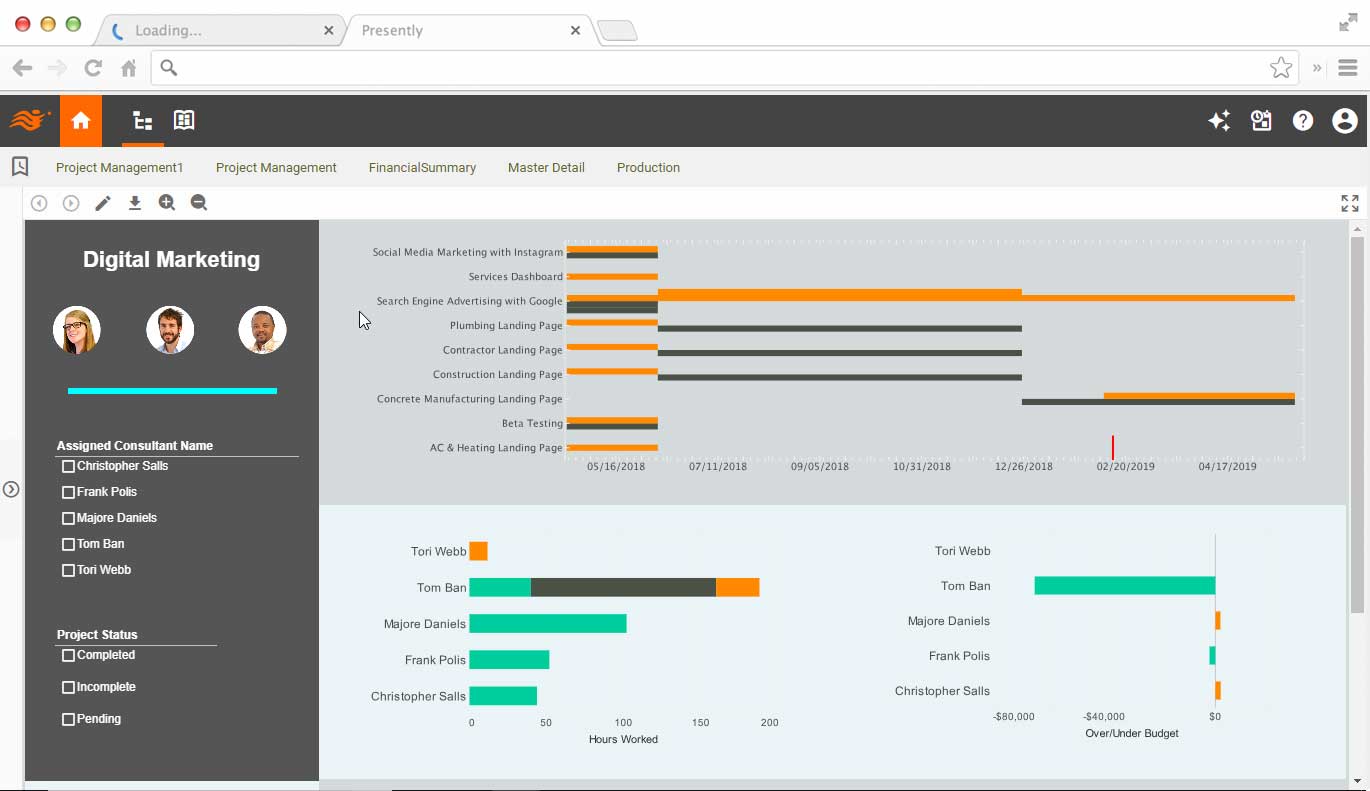
Visualization dashboards are the most intuitive ways to understand project information. However, not all dashboards are created equal. InetSoft's web app can easily connect to project management data to create self-service dashboards with rich built-in interactivity and customization.
Mashup All Project Related Data
For successfully delivery of projects, project managers must utilize all project related data, for example, supply chain and issue tracking system data. These systems are normally scattered. Some third party data may even be in Excel files. InetSoft's data mashup makes data processing a light-weight, business user self-serviceable process with great efficiency.

Online and Offline Reports
Project managers interact, share and collaborate with many parties. Visualization dashboards works excellently in most cases. Offline distributable reports become essential for many occasions where parties must share a large amount of information. InetSoft's pixel perfect, paginated document report engine is specifically designed for these cases.
What KPIs and Metrics Do Project Managers Track?
Project managers track a variety of Key Performance Indicators (KPIs) and metrics to ensure that projects are on track and meeting their objectives. These metrics help project managers assess progress, identify potential issues, allocate resources effectively, and make informed decisions. Here are some common KPIs and metrics that project managers typically track:
Schedule Performance
- Schedule Variance (SV): The difference between the planned schedule and the actual schedule.
- Improve by using rolling-wave planning and frequent progress reviews to catch deviations early.
- Schedule Performance Index (SPI): A ratio of earned value to planned value, indicating schedule efficiency.
- Improve by breaking work into smaller tasks and setting realistic deadlines that can be tracked closely.
Cost Performance
- Cost Variance (CV): The difference between the planned cost and the actual cost.
- Improve by tightening budget tracking with regular financial reviews and variance analysis.
- Cost Performance Index (CPI): A ratio of earned value to actual cost, indicating cost efficiency.
- Improve by renegotiating vendor contracts and optimizing resource allocation to control costs.
Scope Management
- Scope Creep: The increase in project scope without corresponding adjustments in time, budget, or resources.
- Improve by enforcing strict change control processes and ensuring stakeholder alignment before approval.
- Requirements Stability: The percentage of stable requirements throughout the project lifecycle.
- Improve by conducting thorough requirement workshops and validating requirements with stakeholders early.
Quality Metrics
- Defect Density: The number of defects identified per unit of work or deliverable.
- Improve by implementing stronger QA practices and conducting peer reviews before release.
- Customer Satisfaction: Feedback from stakeholders regarding the quality of deliverables and project processes.
- Improve by actively gathering stakeholder feedback and making iterative improvements during the project.
Risk Management
- Risk Exposure: The potential impact and likelihood of identified risks.
- Improve by maintaining a living risk register and prioritizing mitigation strategies for high-impact risks.
- Risk Response Effectiveness: The success of risk mitigation and response strategies.
- Improve by performing regular risk response reviews and adapting strategies based on lessons learned.
Resource Utilization
- Resource Utilization Rate: The percentage of time resources are actively engaged in project work.
- Improve by balancing workloads and using resource management tools to avoid bottlenecks or underuse.
- Resource Allocation: Ensuring that resources are allocated effectively and efficiently across the project.
- Improve by aligning resource assignments with skill sets and project priorities.

Stakeholder Engagement
- Stakeholder Satisfaction: Feedback from stakeholders regarding their level of satisfaction with project communication and engagement.
- Improve by holding regular stakeholder check-ins and tailoring communication to their needs.
- Stakeholder Influence: Assessing the influence and impact of key stakeholders on project outcomes.
- Improve by identifying high-influence stakeholders early and involving them in key decision-making moments.
Communication Metrics
- Communication Frequency: The frequency of project communication activities.
- Improve by setting a structured communication plan with clear schedules for updates and reports.
- Communication Openness: The extent to which project team members feel comfortable expressing concerns and ideas.
- Improve by fostering a culture of transparency and encouraging feedback in meetings.
Schedule Adherence
- On-Time Delivery: The percentage of tasks or deliverables completed on or before the scheduled deadline.
- Improve by using project tracking software and setting buffer times for critical tasks.
- Milestone Achievement: Ensuring that project milestones are achieved according to the planned timeline.
- Improve by monitoring dependencies closely and adjusting resources to keep milestones on track.
Change Management
- Change Request Volume: The number of change requests submitted and processed.
- Improve by clarifying requirements upfront and improving initial project scoping.
- Change Request Approval Rate: The percentage of change requests approved versus those rejected.
- Improve by setting clear criteria for change approvals and educating stakeholders on change impact.