Software for Visual Data Mining
In modern day business, visual data mining is a technique that is increasingly providing a competitive advantage to those who want to harvest insights from their data to increase efficiency, spot trends, and get a better ROI on business efforts. This technique allows users to dynamically view the impact of different factors on data, helping companies with future decision making.
InetSoft's award-winning visual data mining software takes data mining to a whole new level, combining data mining with high-performance visuals, interactive dashboards, and intuitive reporting. Using these features, business users can simultaneously extract information from multiple sources using data mashup technology while analyzing trends, discovering correlations, and even predicting future scenarios.
InetSoft's visual data mining software was made with the end user in mind, offering an easy set-up with a shallow learning curve, while still having powerful and versatile visual charting capabilities to satisfy even the most ambitious data explorer.

Advantages of InetSoft's Approach to Data Mining
InetSoft offers an advantage over competitors by combining unique, intuitive visuals with a user-friendly interface that makes analyzing data quick and easy. With InetSoft's web-based technology, users can access data from just about any source, regardless of database size.
Small data sets are managed with more efficiency than with most popular tools through web-based real-time data access and a robust capacity for visual graphics. However, InetSoft was also created with a priority on handling big datasets, offering data grid cache technology to compress and manage even the biggest datasets without lag time.
Exploration and Flexibility
Perhaps the most significant feature of InetSoft's visual data mining software is the flexibility that it offers the end user. Using various tools, users can experience a new level of exploration and insight into data, allowing the ability to spot new trends that were not readily seen before.
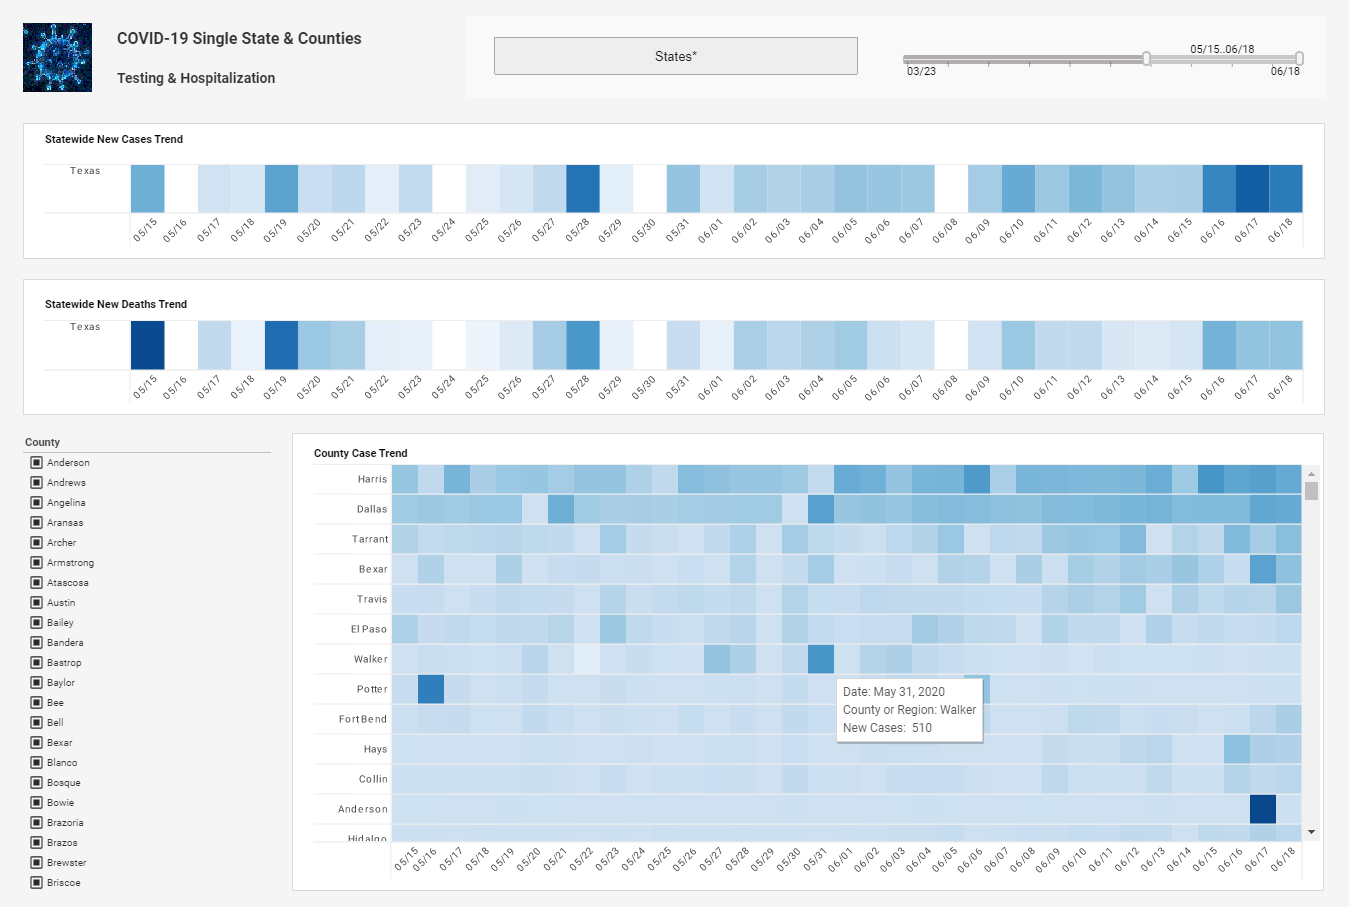
Users can utilize the brushing tool in order to highlight and filter data according to various dimensions and measures in order to display only relevant information.
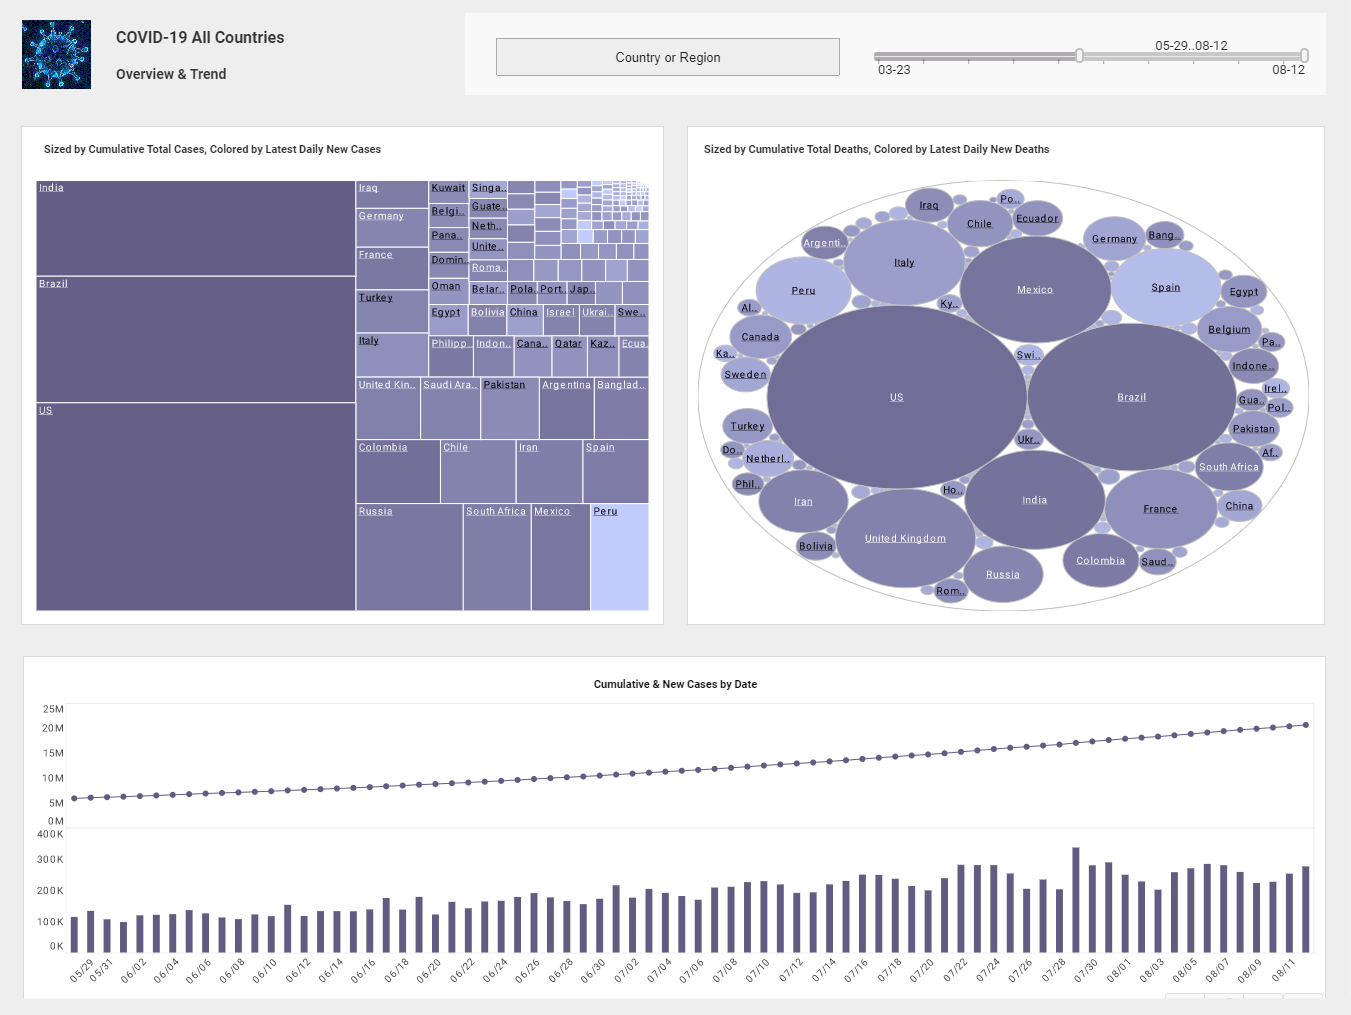
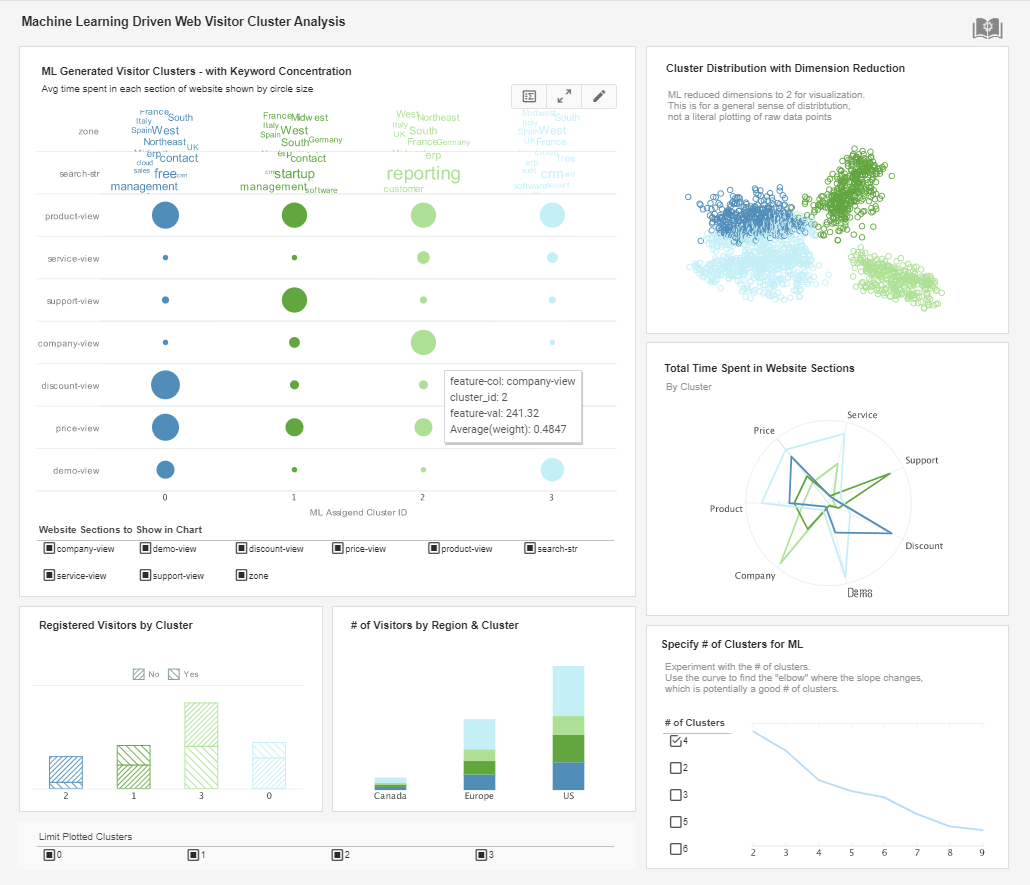
In addition to filtering data, users can also take advantage of InetSoft's multidimensional charting tool to discover new trends. By having the ability to add multiple dimensions or measures to a chart, users can discover correlations by viewing the data represented in different colors, shapes, and sizes. The more ways that data is plotted in a chart, the more possibility the user has for discovering new trends in the data.
For example, while exploring a bubble chart with multiple dimensions, users may notice that the yellow bubbles are also the largest, and therefore discover a trend between the dimensions that are being plotted by color and size.
Once a user finds a significant aspect in the data, they can use the bookmarking tool to save their changes so that they don�t have to search for the correlation next time the report is opened.


