InetSoft Presentation: What If Dashboard Example
This is the continuation of the transcript of an InetSoft presentation and demo for a business intelligence analyst. The highlights are in the area of collaborative BI.
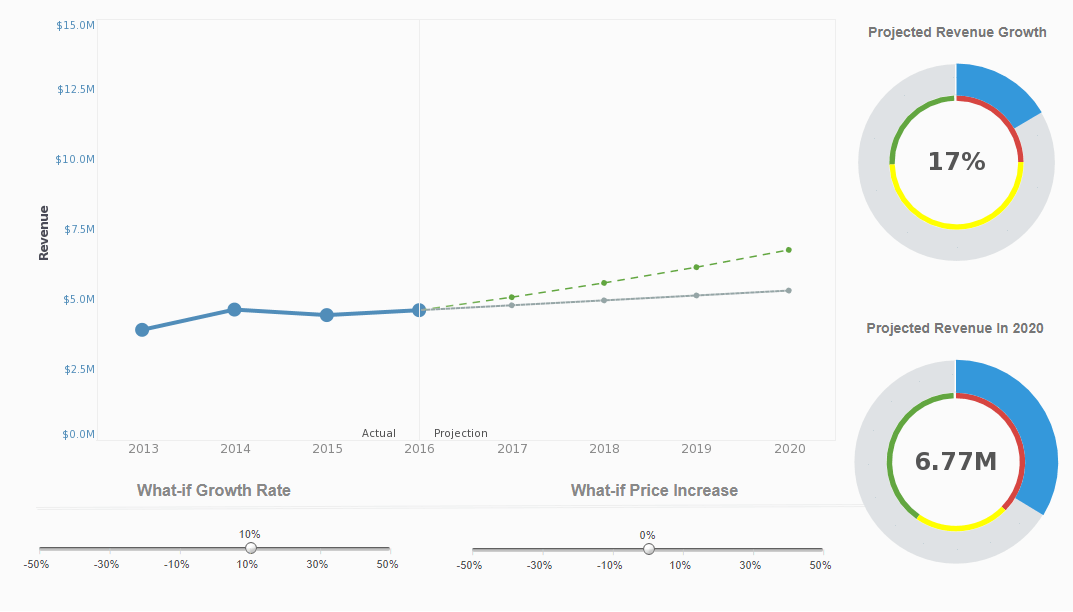
Presenter: So now, we’ll look at an example of a what if dashboard, and the scenario that we would like to cover here, what we like for anyone to take away from that is that the what if scenario we’re looking at my projected revenue, it is not an equation that we force upon you. It’s not an equation that we prepackage. This is an example of an equation that you develop because every vertical is different. Every business is different. Every customer base is different.
You might not just want to calculate overall revenue. You might want to look at a specific or particular product price change or overall price changes. So, what you can do is you can leverage our tool and the powerful data worksheet which we’ll show in a minute. That powerful worksheet tool enables you to take that calculation and you can tie input variables such as changing the growth rate percentage, and you can see how that projection is going to look based on that.
 |
Read how InetSoft saves money and resources with deployment flexibility. |
You can have as many input variables that are tied to input elements as you need in order to have a very comprehensive what if scenario for your business use. Now, I’ve had feedback from customer who actually uses it to make business decisions based on the new market conditions. They actually make changes to the prices of certain product based on demand and based on what their forecasting number looked like.
You can take the time to develop a good equation that fits your business need, and then you can have really nice interactivity here. You can even bookmark certain views here. You can say, hey, you know, we can hit these numbers if we make these chages. Look at this great projection, and you can use the annotation tool and the bookmarks to share that.
This is a little bit more of an advanced option for when you’re actually using the calculation event manipulation that our what-if tool enables you to do with your data to create that what if scenario. So, now I’m going to into the web visualization tool and basically show how you can enable end-users to build dashboards and do the advanced column manipulations in our data worksheet. Do you have questions about the annotations and the bookmarking features and that aspect of the collaborative BI solution?| #1 Ranking: Read how InetSoft was rated #1 for user adoption in G2's user survey-based index | Read More |
Attendee: I’m more curious about what is on your roadmap for that. Are there other BI collaboration features planned?
Presenter: Well, I would say we’ve crossed out some things, things like adding a communication environment. Some business intelligence vendors have tried to create our own communication channel, a discussion board kind of environment and solution. Our view is not to try to duplicate other technologies that are already out there. With our BI platform in the enterprise, they already have some communication applications, chat, email, and a wiki tool, usually. Why try to create another one or get another in our solution?
So, there are more things that we crossed off than things we’re convinced we need to add. At this point it’s as much listening to customers getting formal feedback as well as informal feedback. I would be glad to hear, maybe it’s too soon for you to have some ideas, but what other ideas you may have, as well.
Attendee: One thing I’ve see a couple of BI vendors I talked to, it’s a question of changing the process of your business. What drives that? Is that technology innovation or a cultural change? One thing I see that a couple of other vendors are doing in the collaborative space is that they do storyboards which is an interesting kind of thing. Instead of using PowerPoint, you have an interactive chart that you can talk about in a meeting.
 |
Learn about the top 10 features of embedded business intelligence. |
It’s collaborative in the sense that it’s in person. It’s not just a static presentation. We know people love their Microsoft Office. We’re very used to using PowerPoint. I don’t know if it will ever be replaced. I think it’s a nice feature because it changes the way you think and how you make decisions because if you can have something that’s interactive, they can use the BI system and make it more of ad hoc presentation when you’re in a meeting. That’s one of the features that I’m pretty interested in, but I think you’re pretty on target, if not having done more than other vendors.
Presenter: Yeah, I like this interactive presentation mode.
Attendee: Yeah, just because PowerPoint in that sense, it’s really useful, but it’s not very interactive, and you can’t have a manager ask, why is that, and you have to be like, oh, let me run back to my laptop, or you ask this guy or something so I think that’s where collaborative BI is not just an online tool, it’s changing the way you will make decision in a group instead of seeing how that’s going to work by yourself.
| Previous: Ways You Can Visualize Data |
Next: Demo of a BI Tool
|
