The Top Ten Open Source BI Tools: Pros and Cons
Business Intelligence (BI) tools allow organizations to analyze data and gain insights that guide strategic decisions. Open-source BI tools provide an affordable alternative to proprietary options, empowering organizations with more flexibility and control.
Below is a list of the top 9 open-source BI tools, each with detailed pros and cons to help organizations choose the right fit.

Apache Superset

- Rich Visualizations: Superset offers a broad range of visualizations including charts, tables, and maps, with a large collection of interactive visual components.
- Scalability: It is highly scalable and can handle large volumes of data, making it a good option for enterprises.
- Customizable: Developers can extend and customize the tool to fit their organization's unique needs through plugins.
- Active Community: Apache Superset has a vibrant community that contributes to its ongoing development.
Cons:
- Steep Learning Curve: Its interface is not as user-friendly as Metabase, and users might require some technical knowledge to use the tool effectively.
- Performance Issues with Big Data: While it's scalable, performance can degrade with very large datasets if not configured properly.
- Limited Out-of-the-box Integrations: It may require more manual configurations to integrate with certain databases or systems.
BIRT (Business Intelligence and Reporting Tools)
Pros:
- Highly Customizable: BIRT is an open-source reporting system that allows developers to create highly customized reports and dashboards.
- Web-Based Reports: The reports generated by BIRT can be embedded into web applications, offering flexibility in deployment.
- Strong Data Integration: BIRT supports integration with a wide range of databases, including SQL, XML, and web services.

- Limited Visualizations: Although it supports rich reporting, its visualization options are not as extensive as tools like Tableau or Power BI.
- Technical Expertise Required: BIRT requires a level of technical expertise to install, configure, and use, which may be a barrier for non-technical users.
- Outdated Documentation: Some users report that the documentation is not as up-to-date as they would like, making troubleshooting more difficult.
Grafana

- Real-Time Dashboards: Grafana excels in creating real-time dashboards and visualizations, making it popular for monitoring system performance and metrics.
- Custom Alerts: Users can set up customized alerts based on data triggers, making it excellent for monitoring and operations.
- Versatile Data Source Integrations: Grafana supports a wide range of data sources, including time-series databases (e.g., Prometheus), SQL databases, and cloud services.
- Powerful Query Builder: Its built-in query editor allows users to create sophisticated queries for in-depth analysis.
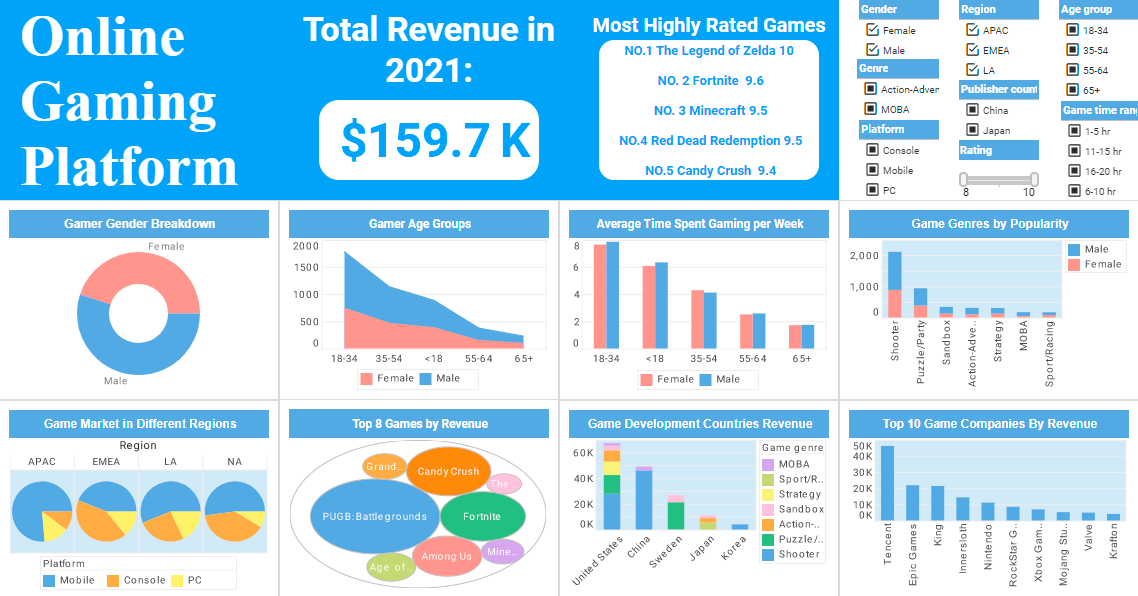
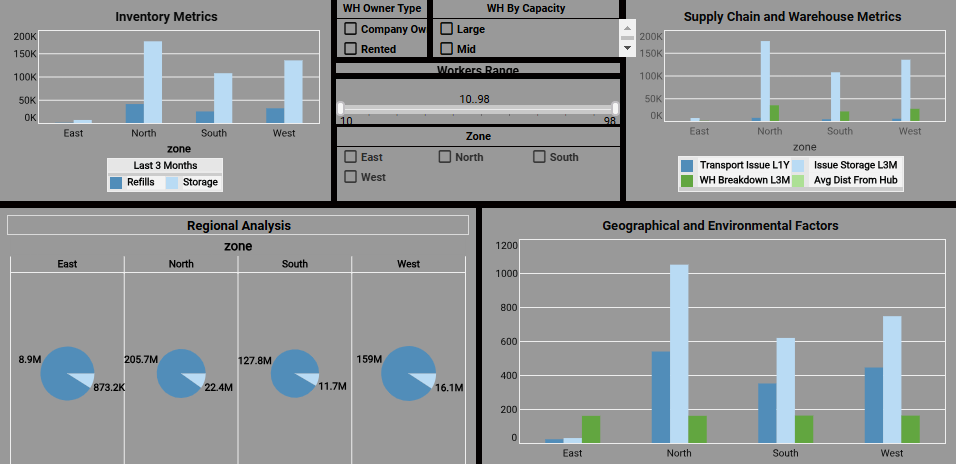
InetSoft
Pros:
- Highly Customizable Dashboards: Users can tailor dashboards and reports according to their specific needs.
- Multiple Data Source Support: Works with various databases and file formats, making integration flexible.
- Strong Data Visualization: Offers a wide variety of chart types, providing dynamic and interactive visualizations.

Cons:
- Setup: Connecting to many web-based data services may require api keys and other credentials which are not always easy to find on the data sources website
- Limited Features in the Free Version: The open-source edition lacks some advanced enterprise features found in the paid versions.
- Steep Learning Curve: New users may find it challenging due to its feature-rich but intricate interface.
Jaspersoft
Pros:
- Advanced Reporting Features: Jaspersoft excels at creating detailed and complex reports that are highly customizable.
- Data Integration: The tool offers strong data integration capabilities, supporting a variety of databases, including SQL, NoSQL, and cloud-based storage.
- Embeddable Analytics: Jaspersoft provides an embeddable version of its analytics and reporting tools, allowing integration into custom applications.
- Strong Community Support: With an active community, users can find a wealth of resources, templates, and guides.
Cons:
- Complex Setup: Jaspersoft can be difficult to install and configure, especially for non-technical users.
- User Interface Could Be Improved: Its UI is functional but can feel outdated compared to newer BI tools.
- Limited Visualization Types: While strong in reporting, Jaspersoft does not offer the same variety of visualizations as some other BI tools.
Metabase
Pros:
- User-Friendly Interface: Metabase is well-known for its simple and intuitive interface, making it easy for non-technical users to build queries and create dashboards.
- Quick Setup: It requires minimal configuration and can be set up in a matter of minutes.
- Flexible Integration: It can integrate with various databases (PostgreSQL, MySQL, etc.) and supports REST API connections for custom integrations.
- Custom Dashboards: Allows for the creation of customizable dashboards that can be shared across teams.

Cons:
- Limited Advanced Features: While it's great for beginners, Metabase lacks some advanced features like complex reporting and extensive data modeling.
- Basic Visualizations: While it offers some visualization types, its offerings are not as extensive as more advanced tools.
- Lack of Customization for Enterprise Needs: Large-scale enterprise users may find the tool's features limiting for complex data analysis or integration with other enterprise systems.
Pentaho

Pros:
- Comprehensive BI Suite: Pentaho offers an end-to-end BI solution, including data integration, data mining, reporting, dashboards, and analytics.
- ETL Capabilities: It has a strong data integration tool (Pentaho Data Integration) which allows users to extract, transform, and load (ETL) data from various sources efficiently.
- Enterprise-Grade Features: Pentaho can support large-scale data analytics needs, making it a great choice for enterprises.
- Extensive Plugin Support: There are many plugins available, enhancing the functionality of the tool.
Cons:
- Complexity: Due to its wide range of features, Pentaho can be overwhelming for new users. Its setup and configuration can be quite complicated.
- Performance Issues with Large Data Volumes: Handling very large datasets can cause performance degradation without proper optimization.
- Clunky User Interface: Some users report that the user interface is not as sleek or modern compared to other tools in this list.
Power BI Desktop (Free Version)
Pros:
- Powerful Analytics: Power BI offers advanced analytics, modeling, and visualization capabilities, making it a robust tool for businesses of any size.
- Excel Integration: Power BI integrates seamlessly with Excel, making it easy to import and analyze data from existing spreadsheets.
- Rich Visualizations: Power BI supports a wide range of visualizations and allows for custom visuals to be created.
- Affordable: The free version of Power BI offers an excellent range of features without the need for a subscription.

Cons:
- Limited Sharing in Free Version: While the free version is powerful, sharing reports and collaborating with others requires a paid subscription.
- Learning Curve: Despite being user-friendly, Power BI's advanced features can be difficult for beginners to grasp.
- Limited Open-Source Features: Although free, Power BI is not fully open-source, and many of its features are restricted to paid versions
 |
Read the top 10 reasons for selecting InetSoft as your BI partner. |
Redash

Pros:
Cons:
- Limited Visualization Options: Redash's visualization options are more basic compared to other BI tools, which could limit the ability to create sophisticated charts and dashboards.
- No Built-in ETL Tooling: Redash focuses on querying and visualization but lacks built-in ETL capabilities, which means additional tools are needed for data preparation.
- Less Ideal for Non-Technical Users: While the interface is user-friendly, the reliance on SQL queries may intimidate non-technical users.
Tableau Public
Pros:
- Stunning Visualizations: Tableau is renowned for its high-quality, interactive visualizations that make data analysis highly engaging.
- Ease of Use: It offers drag-and-drop functionality, making it accessible to non-technical users.
- Broad Data Source Support: Tableau can connect to numerous data sources, including cloud storage, SQL databases, and Excel files.
- Active User Community: Tableau has a large and active user community that regularly contributes to online forums, templates, and best practices.

Cons:
- Public Data Sharing: Tableau Public only allows users to publish visualizations publicly, which may be a dealbreaker for those with sensitive data.
- Limited Functionality in Free Version: The free version has limitations compared to the paid version, including fewer features and reduced customization options.
- Not Fully Open Source: While Tableau has a free version, it is not fully open-source, and some core features are locked behind paid plans.
Conclusion
When choosing an open-source BI tool, it’s crucial to consider the specific needs of your organization, the skill level of the users, and the complexity of the data analysis required. Tools like Metabase and Redash are great for simplicity and ease of use, while Apache Superset and Grafana offer more advanced features for technical users.
Pentaho and Jaspersoft provide robust, enterprise-grade solutions but may require more configuration.
For a more visualization-heavy approach, InetSoft, Tableau Public, and Power BI Desktop are great options, though their open-source offerings have limitations. Each tool has strengths and weaknesses, so evaluate them based on the goals and resources of your organization.