.NET Reporting and Dashboards
Reporting is an essential part of any business. Whether you're tracking sales, inventory, or expenses, you need to manage important information. With InetSoft reporting, you can create professional looking reports in minutes.
Are you looking for .NET reporting and dashboard solutions? InetSoft's BI software integrates easily into a .NET environment. View a demo and try a free online trial.
.NET Integration Options
Integration can be as simple or as complex as you want it to be. InetSoft's Style Intelligence is a Web application, so all commands can be sent to the application server via a Web URL.
The recommended approach is to use IFRAMES. The source of that IFRAME will point to an InetSoft server instance.
You can set up a seamless sign on to the InetSoft report portal by passing in the "userid" and "password" as URL parameters or hidden form fields.
You can selectively skin out portions of the InetSoft portal and embed them in the ASP.
Customize your .NET reports with charts, graphs, and more
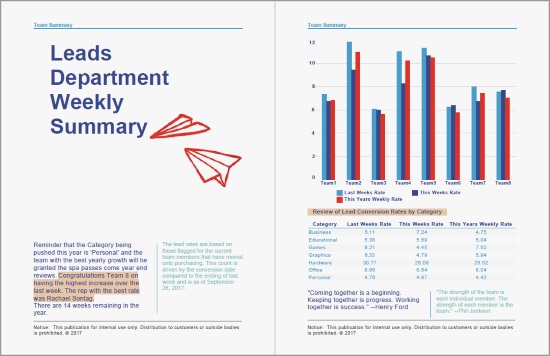
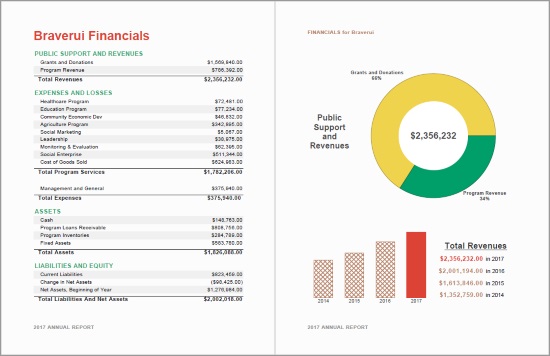
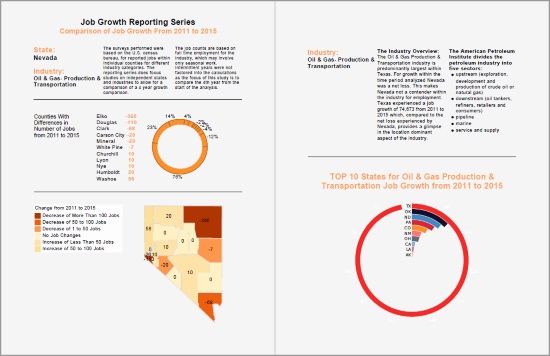
You can customize your .NET report by adding data fields, changing chart types, and even creating custom charts. You can also add text boxes, images, and other elements to make your report unique.
Reports are a vital tool for businesses, especially those who want to stay competitive. If you're running a retail store, you'll want to know which products sell best during different times of day. Or if you own a restaurant, you might want to see what items customers order most often. You can use InetSoft's .NET Reporting to create custom reports that show exactly what you want to see.
Export your .NET reports as PDF or Excel files.
Reports are an essential part of any organization. They help you understand what's happening with your company and how well you're doing. With the right reporting software, you can easily generate reports that show exactly what you need to see.
The best thing about using InetSoft for .NET Reporting is that it's easy to use. You can quickly generate reports from data stored in SQL Server databases, Microsoft Access databases, flat text files, XML documents, or any other source. And if you want to export your report into a PDF file or an Excel spreadsheet, you can easily do that too.
Drag and drop data from Excel or Access into the report designer.
The best part about using InetSoft for .NET Reporting is that you can drag and drop data from Excel, Access, SQL Server, and any other databases directly into the report designer. You can then customize the layout of each page and add text boxes, charts, images, and more. Once you've created your report, you can save it as a PDF file or print it.
How to Extract a .NET Report
If you want to extract the "Report" tab in the ASP, you can use the following URL format:
http://{host name}:{port}/sree/Reports?op=portal_report
This will show the user his report tree and the empty pane on the right where the dashboards and reports will be displayed.
If you want to completely customize the report tree list, you can do that as well.
.NET Dashboard Integration Example
If you wish to only display one report or dashboard you simply call a URL from inside an IFRAME. For embedding dashboards, use a URL of this format:
http://{host name}:{port}/sree/Reports?op=vs&path=/Dashboards/Sales+Explore
For embedding reports, use a URL of this format:
http://{host name}:{port}/sree/Reports?op=FrameReplet&name=Tutorial/Interactive
About Using the IIS Tomcat Connector
You do not need to have the IIS Tomcat connector. You can simply link the .NET portal to the default InetSoft installer by just using an IFRAME and a parameterized URL.
What Are the Technical Considerations When Deploying Java-based Dashboards in a .NET Environment?
Deploying Java-based dashboards in a .NET environment can present several technical considerations that must be addressed to ensure seamless integration and optimal performance. These considerations span compatibility, integration, security, performance, and maintenance aspects. Here's a detailed exploration of these considerations:
1. Compatibility and Interoperability
a. Platform Compatibility
- Ensure that the Java-based dashboards are compatible with the .NET environment. This includes verifying that both Java and .NET frameworks can coexist without conflicts.
- Consider using tools like Java Native Interface (JNI) or Java/.NET Interoperability tools (e.g., JNBridge, IKVM.NET) to facilitate communication between Java and .NET components.
b. Middleware Integration
- Use middleware solutions to bridge the gap between Java-based applications and .NET services. Middleware can manage communication, data exchange, and process coordination between the two environments.
2. Integration Strategy
a. Web Services and APIs
- Leverage web services (SOAP/REST) or APIs to enable communication between Java-based dashboards and .NET applications. This approach allows for a loosely coupled integration where each system can operate independently while exchanging data seamlessly.
- Ensure that the APIs used are well-documented and secure.
b. Data Integration
- Use data integration tools and middleware that support both Java and .NET environments to facilitate data exchange.
- Consider adopting an Enterprise Service Bus (ESB) for complex integrations involving multiple systems.
3. Security Considerations
a. Authentication and Authorization
- Implement robust authentication and authorization mechanisms to ensure secure access to the dashboards. Use industry-standard protocols like OAuth2 or JWT for token-based authentication.
- Ensure that the authentication systems in the .NET environment are compatible with the Java-based dashboard's security protocols.
b. Data Encryption
- Ensure that data exchanged between Java and .NET components is encrypted using secure protocols (e.g., TLS/SSL).
- Use encryption libraries and frameworks that are compatible with both Java and .NET to protect sensitive data.
c. Secure Coding Practices
- Follow secure coding practices in both Java and .NET applications to prevent common vulnerabilities like SQL injection, cross-site scripting (XSS), and cross-site request forgery (CSRF).
- Regularly perform security audits and penetration testing on both environments to identify and mitigate security risks.
4. Performance Optimization
a. Resource Management
- Optimize resource allocation and management to ensure that the Java-based dashboards do not adversely impact the performance of the .NET environment. This includes managing CPU, memory, and I/O resources efficiently.
- Use performance monitoring tools to track the performance of both Java and .NET applications and identify bottlenecks.
b. Load Balancing
- Implement load balancing strategies to distribute the workload evenly across servers. This helps in managing high traffic and ensuring high availability and reliability of the dashboards.
- Consider using reverse proxies or load balancers that support both Java and .NET environments.
5. Maintenance and Support
a. Version Compatibility
- Ensure that the Java and .NET runtime environments are kept up-to-date with the latest versions and patches to maintain compatibility and security.
- Regularly test the compatibility of new updates or patches to avoid potential disruptions.
b. Logging and Monitoring
- Implement comprehensive logging and monitoring mechanisms to track the performance and health of the Java-based dashboards and .NET applications.
- Use centralized logging solutions that can aggregate logs from both environments for easier troubleshooting and analysis.
c. Automated Deployment
- Use automated deployment tools and continuous integration/continuous deployment (CI/CD) pipelines to streamline the deployment process. Tools like Jenkins, Bamboo, or Azure DevOps can help in managing deployments across both Java and .NET environments.
- Ensure that the deployment process includes automated testing to verify the integrity and performance of the dashboards.
6. Development Tools and Frameworks
a. Integrated Development Environment (IDE)
- Choose development tools and IDEs that support both Java and .NET development, such as Eclipse, IntelliJ IDEA, or Visual Studio with appropriate plugins.
- Ensure that the development team is proficient in using these tools to facilitate efficient development and debugging.
b. Frameworks and Libraries
- Use frameworks and libraries that are compatible with both Java and .NET for common functionalities like data access, logging, and security.
- Consider using cross-platform frameworks (e.g., Spring Boot for Java and ASP.NET Core for .NET) to ensure consistent development practices and easier integration.
7. User Interface and User Experience
a. Consistent UI/UX
- Ensure that the user interface (UI) and user experience (UX) of the Java-based dashboards are consistent with the .NET applications to provide a seamless experience for users.
- Use front-end frameworks (e.g., Angular, React, or Vue.js) that can work with both Java and .NET backends to ensure a uniform look and feel.
b. Responsive Design
- Implement responsive design principles to ensure that the dashboards are accessible and usable across different devices and screen sizes.
- Test the dashboards on various devices and browsers to ensure compatibility and usability.
More Articles About .NET Dashboards
Information About Dashboard Scripting - In certain dashboard applications, you may require a greater degree of control and flexibility than the basic Viewsheet components can provide. For example, you may want to hide certain dashboard components when a particular condition occurs, such as when the user's selections return no data. Likewise, you could present a specific alert message to the user if a key indicator does not meet its target...
Lessons Learned Metrics - For ongoing progress, it is essential to draw lessons from the past. These metrics concentrate on documenting and applying the lessons learned from earlier efforts. In this area, important metrics include: Lessons Learned Implementation Rate: It assesses the proportion of lessons learnt that have been applied to succeeding initiatives, assuring improvement and knowledge transfer...
No Compromise with Clarity - Dashboards can be beneficial for customer service centers as the data presented in them is always of the best clarity. Also, helps in looking through the company's statistics at a specific point in time...
Strong Analytical Culture Leads To Best Performance - The best performing companies are more likely to report a stronger analytical culture, one that sees value in the timely analysis of relevant data in order to support major decisions as opposed to those that just run largely on gut feel. Also the best run companies are more likely to employ what's frequently referred to as a data scientist, someone dedicated to the data that understands not only how to manage and improve the cleanliness...


