InetSoft's BI Dashboard Software: Easy, Agile and Robust
Researching BI dashboard software? InetSoft offers flexibly-priced BI software for dashboards, reports and analytics that can be easily deployed and used - in weeks, not months.
Introduction
Style Intelligence is business intelligence software for dashboards, reporting, and analysis. It blends enterprise strength with a small, 100% Java footprint. Unlike traditional BI dashboard tools, Style Intelligence does not require specialized BI skills or consultants to implement or use. Patent pending Data Block technology is the foundation for Style Intelligence’s flexible and high performance data access.
Technologists as well as end users can dynamically assemble, transform, and mash up data in a Lego-like fashion. Compressed, in-memory data representation ensures efficient and rapid responses to user data requests.
Two applications are built on top of this Data Block technology: visualization and publishing.
- Visualization provides interactive information access that enables exploration, for example, interactive dashboards.
- Publishing allows for codification and distribution of information to a wide audience through publishing technologies, exemplified by pixel-perfect reports.
 |
View a 2-minute demonstration of InetSoft's easy, agile, and robust BI software. |
Key Applications Created with BI Dashboard Tools
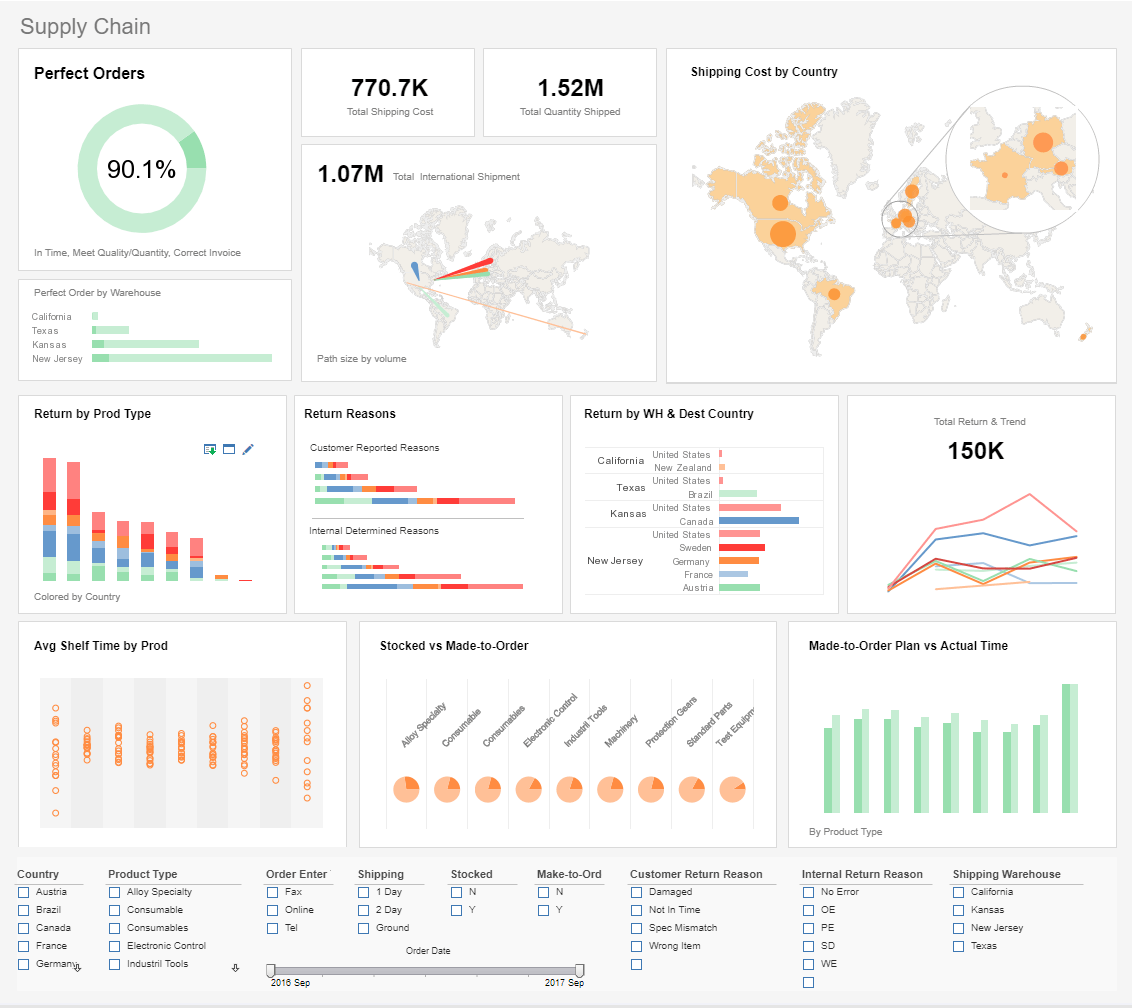
Monitoring Dashboards: Aggregated information views using intuitive display objects. Give managers the current status with the ability to drill down and investigate.
Analytic Dashboards: Explore data to gain new insights through multi-dimensional visual charting. Simple point-and-click manipulation enables discovery of hidden patterns and relationships.
BI Dashboard Software Features
- Interactive Dashboards - view data by creating interactive objects (data selection drop-downs, tables, crosstabs, charts, maps, gauges, thermometers, sliders, calendars, etc.)
- Multi-dimensional Charting - use colors, shapes, and stacked x/y axes to add additional dimensions, displaying more information in a single chart
- Multi-charts - aka trellis graphs, visual crosstab, or small multiples; use to compare many series side by side to spot trends or outliers
- Maps - plot summarized data by geography, and interactively explore using zoom, and pan
- Expression Formula - add an expression or formula column using SQL or JavaScript syntax
- Highlighting - conditionally format important information using color or font properties
- Brushing - select data points in one chart to highlight related points in accompanying charts
- Named Groups - group categorical and numeric data into buckets or ranges
- What-If Analysis - experiment with scenarios by combining user input with dynamic data
- Visual Analysis - perform multi-dimensional visualization and analysis on OLAP cubes and non-cube data; use point-and-click interactivity to explore large amounts of data in a single analytical space
- Report Integration - drill down to reports or embed reports in dashboards


