InetSoft's BI Software - Easy, Agile, Robust.
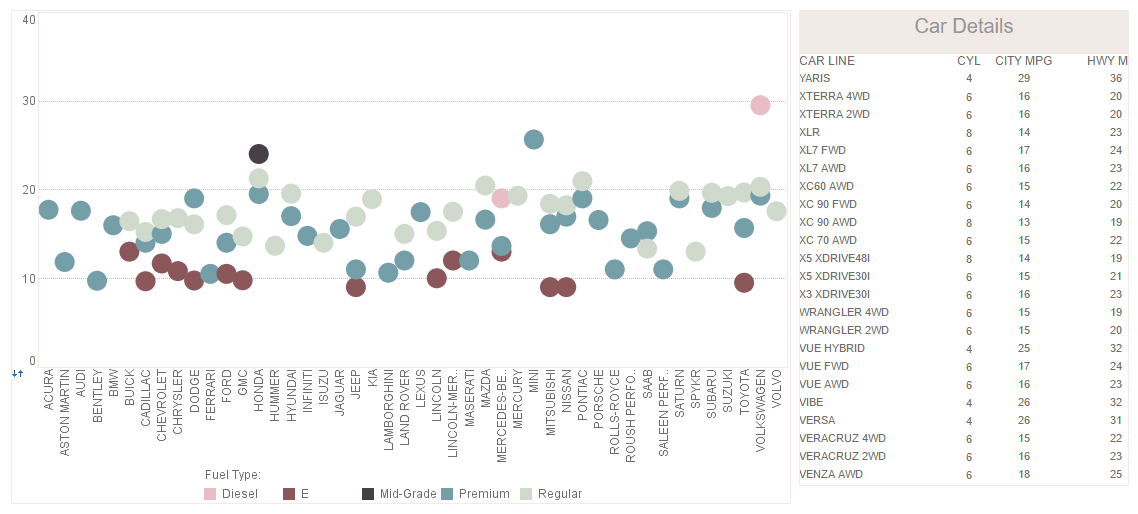
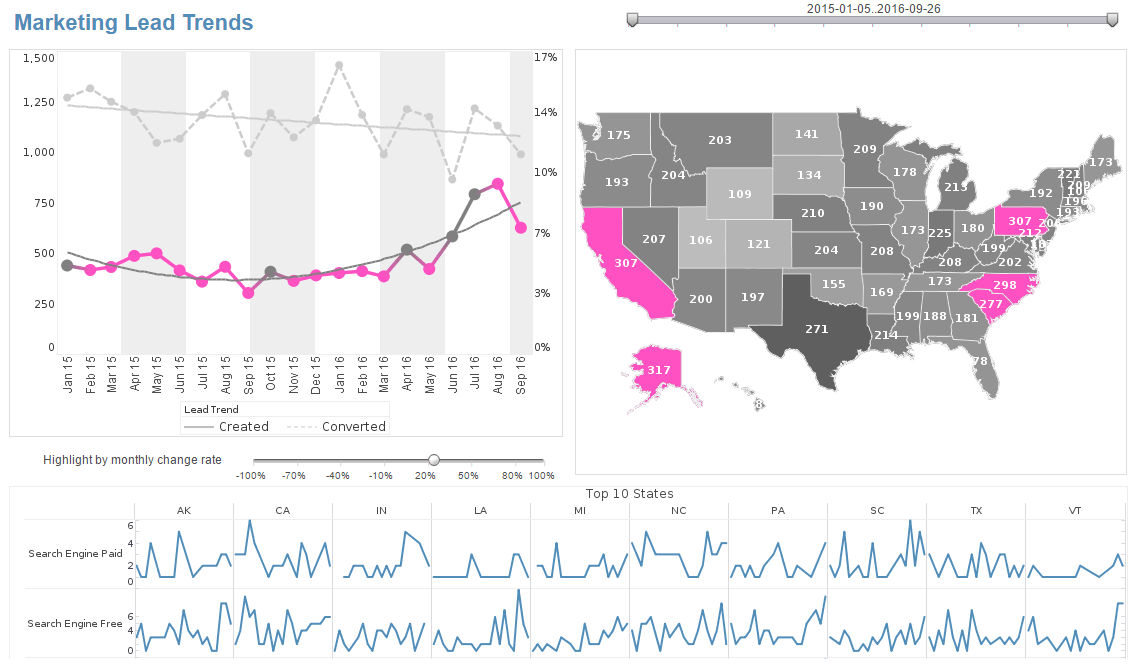
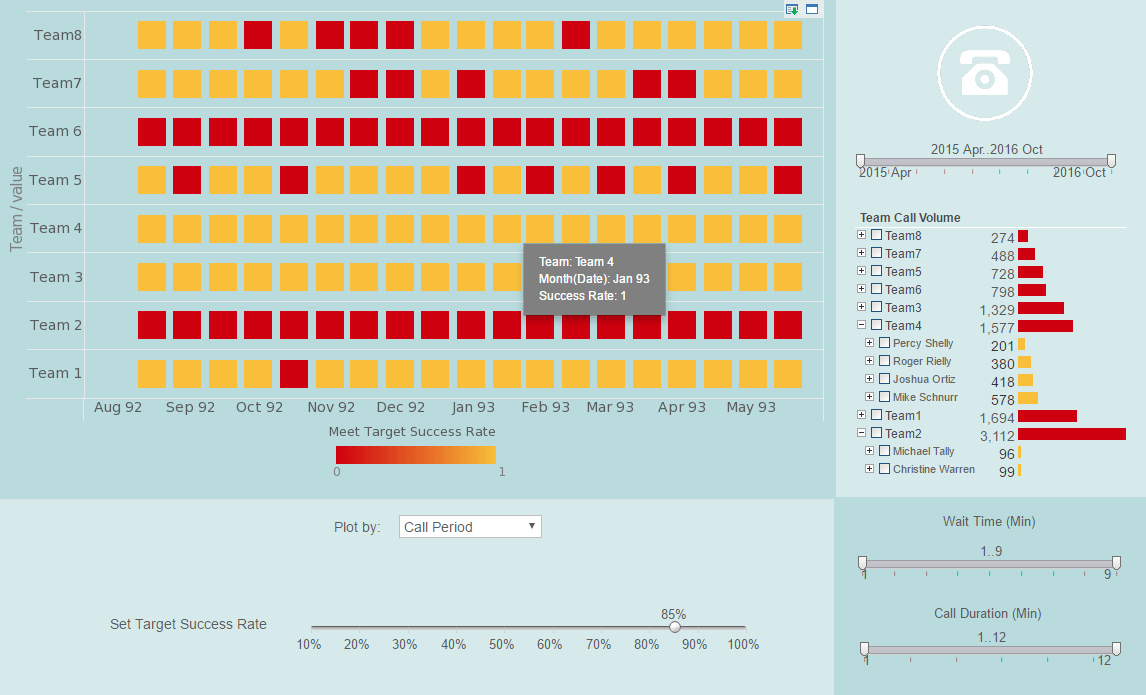
InetSoft offers BI software for dashboards, analysis, and reporting that is easy, agile, and robust. InetSoft's flagship product, Style Intelligence™, includes highly interactive and visually compelling interfaces and a sophisticated charting engine for multi-dimensional visual analysis, scorecards, and KPI dashboards.
Key benefits include:
- Utilize existing data directly, realize immediate return on investment
- Gradually introduce more self-service without disruptions
- Share information among operational users, power users, and executives
 |
View a 2-minute demonstration of InetSoft's easy, agile, and robust BI software. |
BI Software That Yields Immediate ROI
For business intelligence applications, it's often a gradual process of first effectively utilizing basic production reports then increasing end-user self-service with more sophisticated business intelligence tools.
Instead of providing such a natural growth path, traditional business intelligence software has tended to force a big-bang approach that requires tremendous resources to start off, and locks users into a complex infrastructure.
Because of the high initial and maintenance costs, business intelligence tends to be viewed as a luxury reserved for deep pocketed companies only. On the other hand, single function software lacks the depth for non disruptive growth.
InetSoft's BI software, Style Intelligence, provides a flexible, step-up approach that leverages existing investments in infrastructure, IT, and end-user experiences. Instead of forcing an expensive, big bang "solution" on customers, Style Intelligence provides "business intelligence at your own pace" by allowing the customer to gradually build up BI functions to meet the needs of the customers.
An initial Style Intelligence implementation may include support for production reports for a transactional database and then may be upgraded as needed to include, interactive reports, ad-hoc reporting, on-line data analysis (OLAP) on data warehouses, scheduling, and exception alerts. By taking advantage of this component based, modularized design, Style Intelligence provides a platform that ensures immediate, measurable return on investment.BI Software that Carries a Lower Cost of Ownership
Based on XML, SOAP, J2EE, and JavaScript, Style Intelligence is designed from the ground up with a 100% open standards foundation. Out of the box, Style Intelligence employs a complete open software stack that uses Apache Tomcat J2EE as the platform. JavaScript engine, standard DOM XML parser, and many other industrial strength components form Style Intelligence's complete infrastructure.
Because Style Intelligence is actually a standard Web application deployed into Tomcat, it can be deployed into any J2EE web platform, from commercial platform Weblogic and Websphere to open source alternatives, JBoss and Apache Tomcat. Style Intelligence can then be managed and supported just as a regular Web application to minimize support and administrative costs.
For the report designer, Web skills such as JavaScript, HTML, and JSP can be readily applied to report design. Standardized skill sets greatly lessen the burden for IT recruiting, training, and managing.
Style Intelligence has equally strong support for both transactional databases and data warehouses. Transactional databases can be used as the foundation reporting source. The flexibility of Style Intelligence provides many analysis abilities that traditionally would have required a data warehouse. Data warehouses can be added to Style Intelligence when analysis complexity or performance requires so.
With open standards architecture, Style Intelligence delivers a lower total cost of ownership.| #1 Ranking: Read how InetSoft was rated #1 for user adoption in G2's user survey-based index | Read More |
How Do Machine Tool Companies Use BI Software?
Machine tool companies leverage Business Intelligence (BI) software to enhance decision-making processes, optimize operations, and gain insights into various aspects of their business. Here's a detailed exploration of how machine tool companies can effectively utilize BI software:
- Performance Monitoring:
- Production Metrics: BI software helps monitor key performance indicators (KPIs) related to production efficiency, machine utilization, and overall equipment effectiveness (OEE).
- Downtime Analysis: Identifying and analyzing downtime events can help in optimizing machine uptime and productivity.
- Supply Chain Management:
- Inventory Optimization: BI tools assist in managing inventory levels efficiently by providing insights into demand patterns, supplier performance, and material consumption.
- Supplier Relationship Management: Machine tool companies can use BI to evaluate and monitor the performance of their suppliers, ensuring a reliable and efficient supply chain.
- Sales and Marketing Analytics:
- Sales Performance: BI software aids in analyzing sales data, identifying trends, and evaluating the performance of different products or product lines.
- Customer Segmentation: Companies can use BI to segment their customer base, allowing for targeted marketing strategies and personalized customer interactions.
- Financial Analysis:
- Cost Analysis: BI tools help in analyzing costs associated with production, maintenance, and other operational activities, enabling better cost control.
- Revenue Forecasting: Forecasting tools within BI software assist in predicting future revenues based on historical data and market trends.
- Quality Control:
- Defect Analysis: BI can be applied to monitor and analyze quality control data, identifying patterns related to defects and enabling proactive measures to improve product quality.
- Compliance Monitoring: Ensuring compliance with industry standards and regulations can be facilitated through BI tools that provide visibility into adherence to quality and safety protocols.
- Predictive Maintenance:
- Machine Health Monitoring: BI software, when integrated with IoT (Internet of Things) sensors, can predict machine failures by monitoring equipment health and performance data.
- Maintenance Planning: By analyzing historical maintenance data, companies can optimize their maintenance schedules, reducing unplanned downtime and extending the lifespan of machinery.
- Employee Performance and Training:
- Training Effectiveness: BI can be used to evaluate the effectiveness of training programs, ensuring that employees have the necessary skills to operate and maintain machinery.
- Workforce Productivity: Monitoring employee performance metrics helps in identifying areas for improvement and optimizing workforce productivity.
- Strategic Planning:
- Market Analysis: BI tools assist in analyzing market trends, competitor performance, and customer feedback, aiding in the development of informed strategic plans.
- Business Forecasting: Machine tool companies can use BI for long-term business forecasting, helping them adapt to changing market conditions.
- Dashboards and Reporting:
- Customized Dashboards: BI tools offer customizable dashboards that provide a real-time overview of critical business metrics, allowing quick and informed decision-making.
- Ad Hoc Reporting: Users can generate ad hoc reports to delve deeper into specific aspects of the business, facilitating detailed analysis.
More Resources for Evaluators of BI Software
Business Users Create Their Own Visualizations - Advanced data visualization features are not only a convenience for developers. More importantly, the existence of these features enables business users to create their own visualizations, and consequently opens up visualizations to a whole new area of usage that's not possible when graphs must be hand crafted...
Creating a Join in InetSoft - Creating any of these join types is extremely easy in the InetSoft Visual Composer. To create a join, select the two tables that you want to join, and press the Join button in the toolbar. Select the desired join type...
Demonstration of How to Create a Data Visualization - So I am going to create another data visualization. I think I will simplify it a little bit. I will show you something along the way. I drag product type in market. Now we just have the states. I can make it a density plot. And in fact, I can even break it down further, and here is a density plot of all the area codes in this data set. And as you can see, there are some...
Different Versions of a Single Dashboard - This is extremely common. An operational person on the front line will need to see a certain granularity of data, and then his manager wants to see what he is doing. His manager wants to see what all the employees are doing. Can you make one dashboard that handles all of these needs or do they end up being discrete...
 |
View the gallery of examples of dashboards and visualizations. |
Evaluate InetSoft's Optimizely Dashboard Solution - Are you looking for a good solution for Optimizely dashboard reporting? InetSoft's pioneering BI application produces great-looking dashboards that give you more self-service analytic capabilities. View a demo and try interactive examples...
Executives Want the Smartest Data - A big part of getting data right and having access to smart data is being able to see performance objectives and and thresholds. Usually scorecards and key performance indicators are displayable from a dashboard interface, but they remain static, almost as if they are a simple reporting method that has been tacked on to a report, of built in a post-design phase. This leaves...
Facilitating Data Exploration - Where we have seen great success with InetSoft is in facilitating data exploration. We talked about the rising self-service data prep tools. That has helped people be able to blend data for multiple sources where in the past they would've had to go through ETL work to the data warehouse, they are able to do that more on-the-fly, more agilely...
Highlighting Data in a Report - InetSoft's reporting software allows users to highlight data thereby facilitating the communication of the most important information. View the example below to learn more about the Style Intelligence solution...
Performance Management More Strategic - The historical reasons for using BI were to disseminate information. Now companies are thinking about performance metrics and performance management more strategically. Everybody is creating management dashboards. That creates a higher visibility for today's BI technologies, but there are places where you can get even higher ROI...


