A Business Intelligence RFI Template: Seeking Self-Service Reporting
This is the continuation of a BI RFI template received from a large US nonprofit wanting self-service reporting and analytics. InetSoft's responses are provided.
Provide IT-enabled and business user self-service capabilities
Capabilities such as cascading parameters and nested prompts, data virtualization and drill anywhere
Data virtualization is one of the design principles underlying our Data Block technology and data mashup engine. User do not need to know where data blocks are sourced or reside. They just assemble them into a way that is needed. Because of this flexibility in the data layer, end users can drill in any path they define.
Cascading parameters and nested prompts are widely used in our reporting interface. Report designers can make many paths, forks, and levels to guide users with zero experience to the data they need.
 |
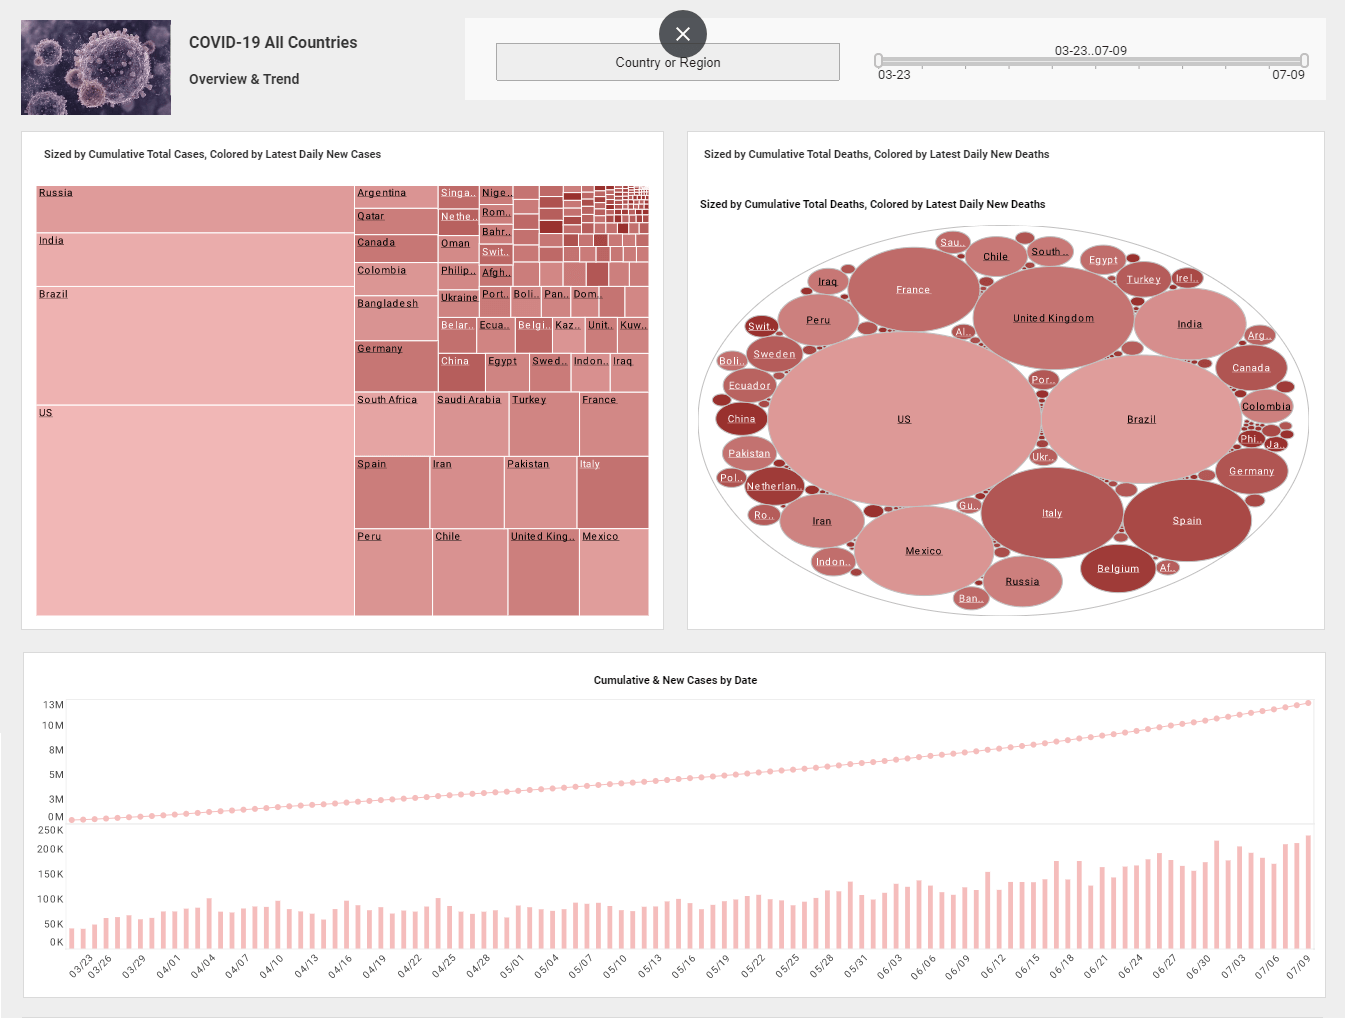
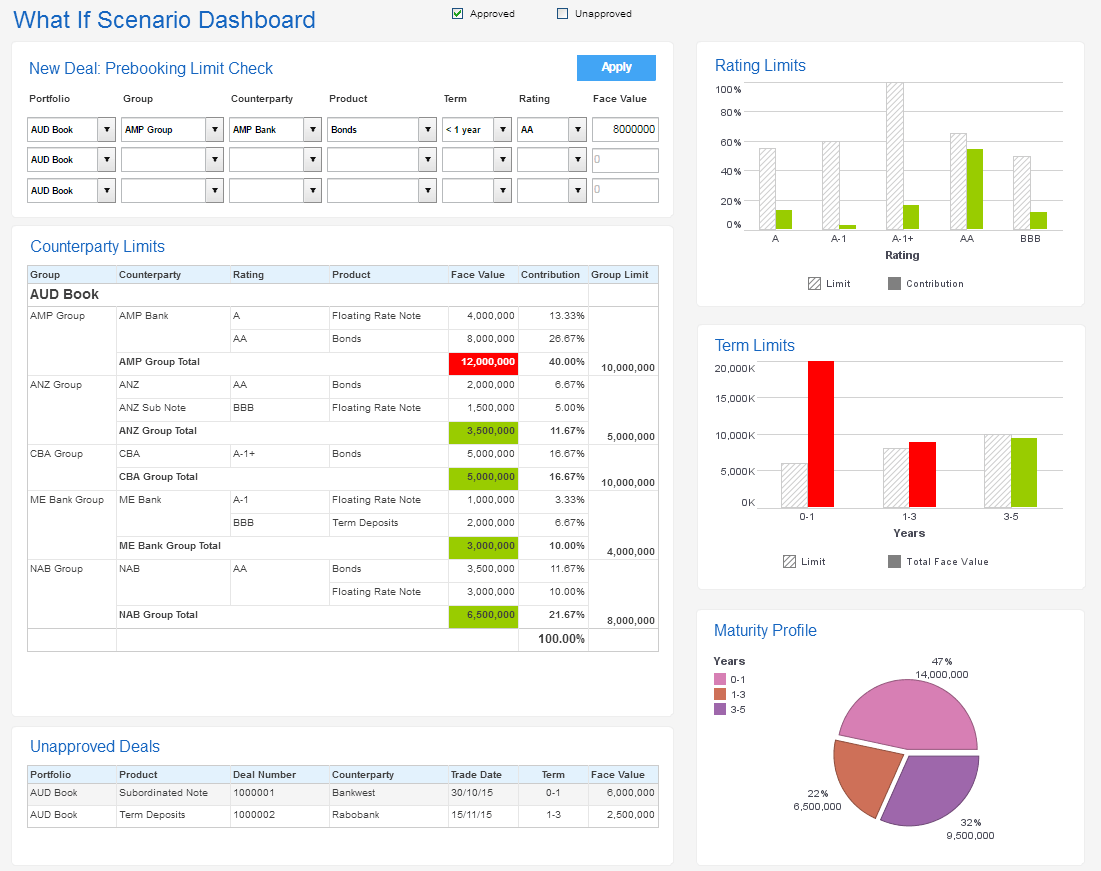
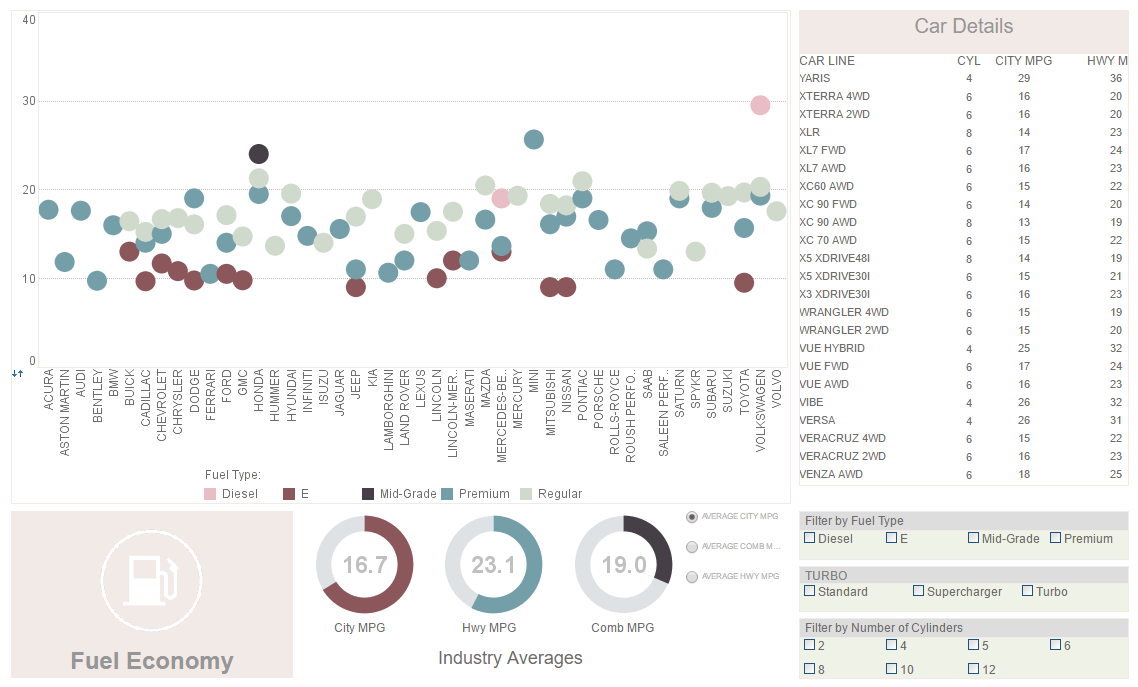
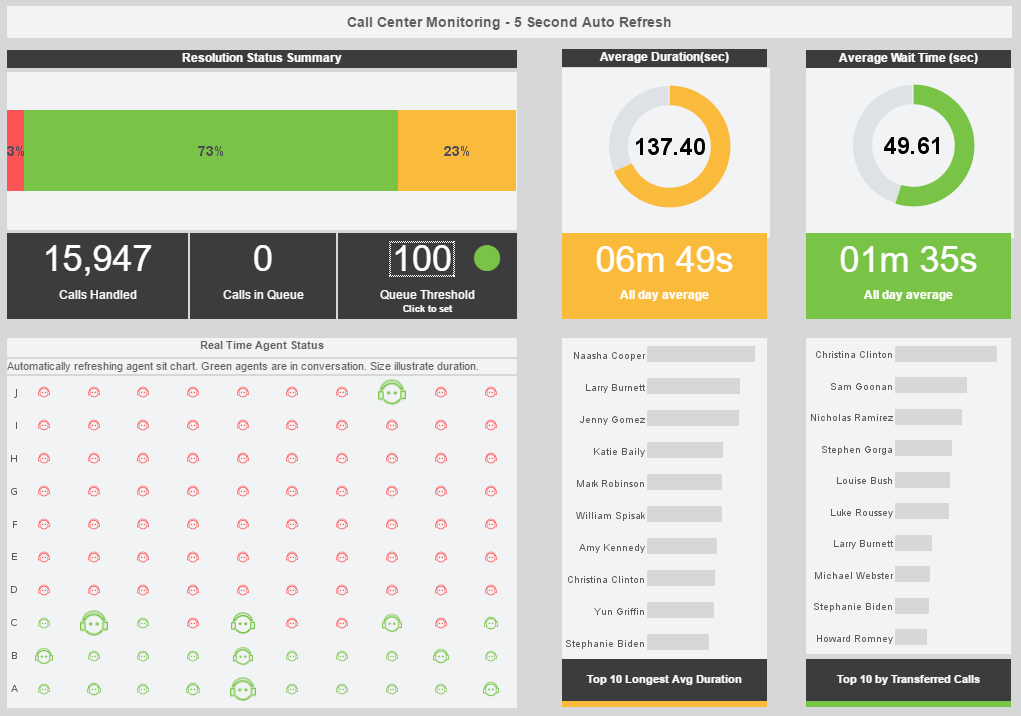
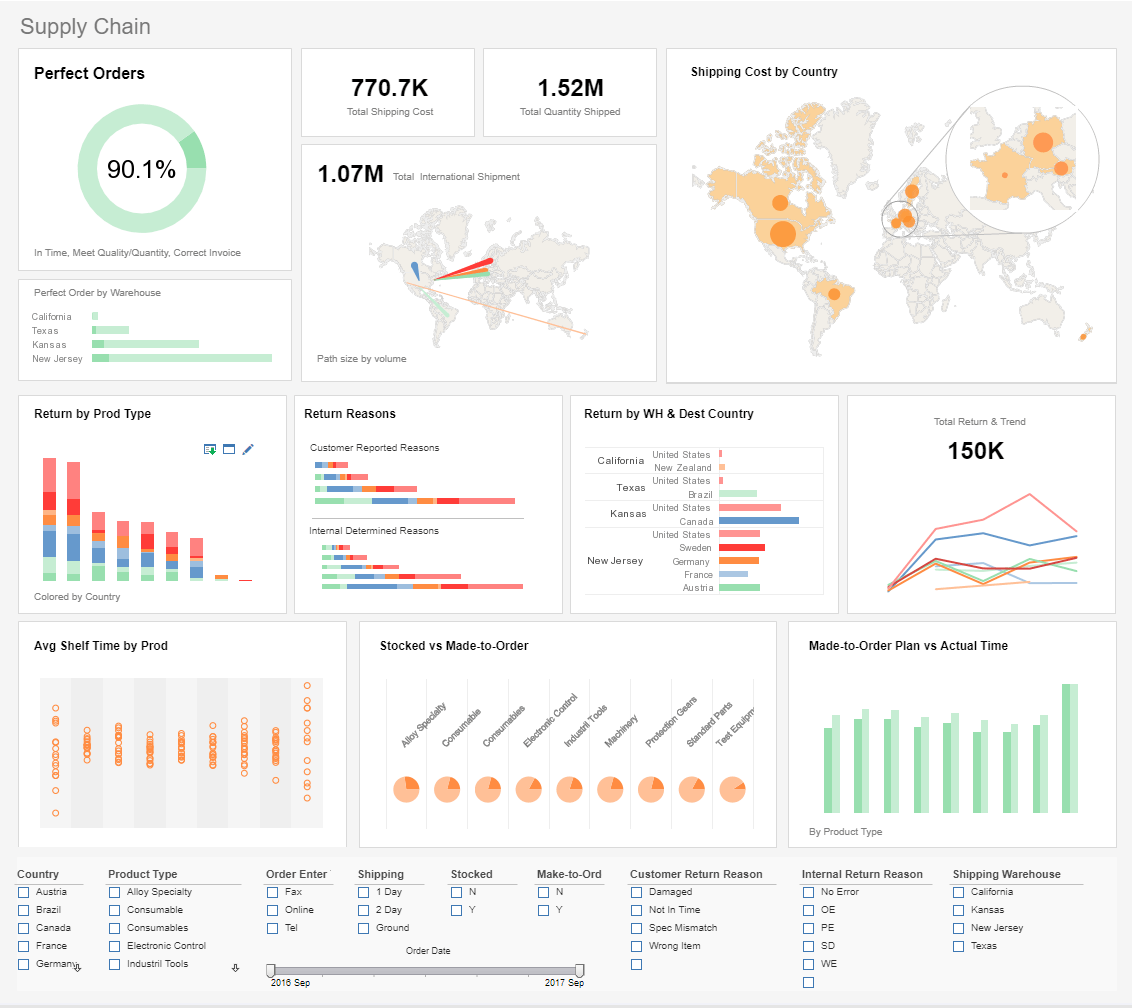
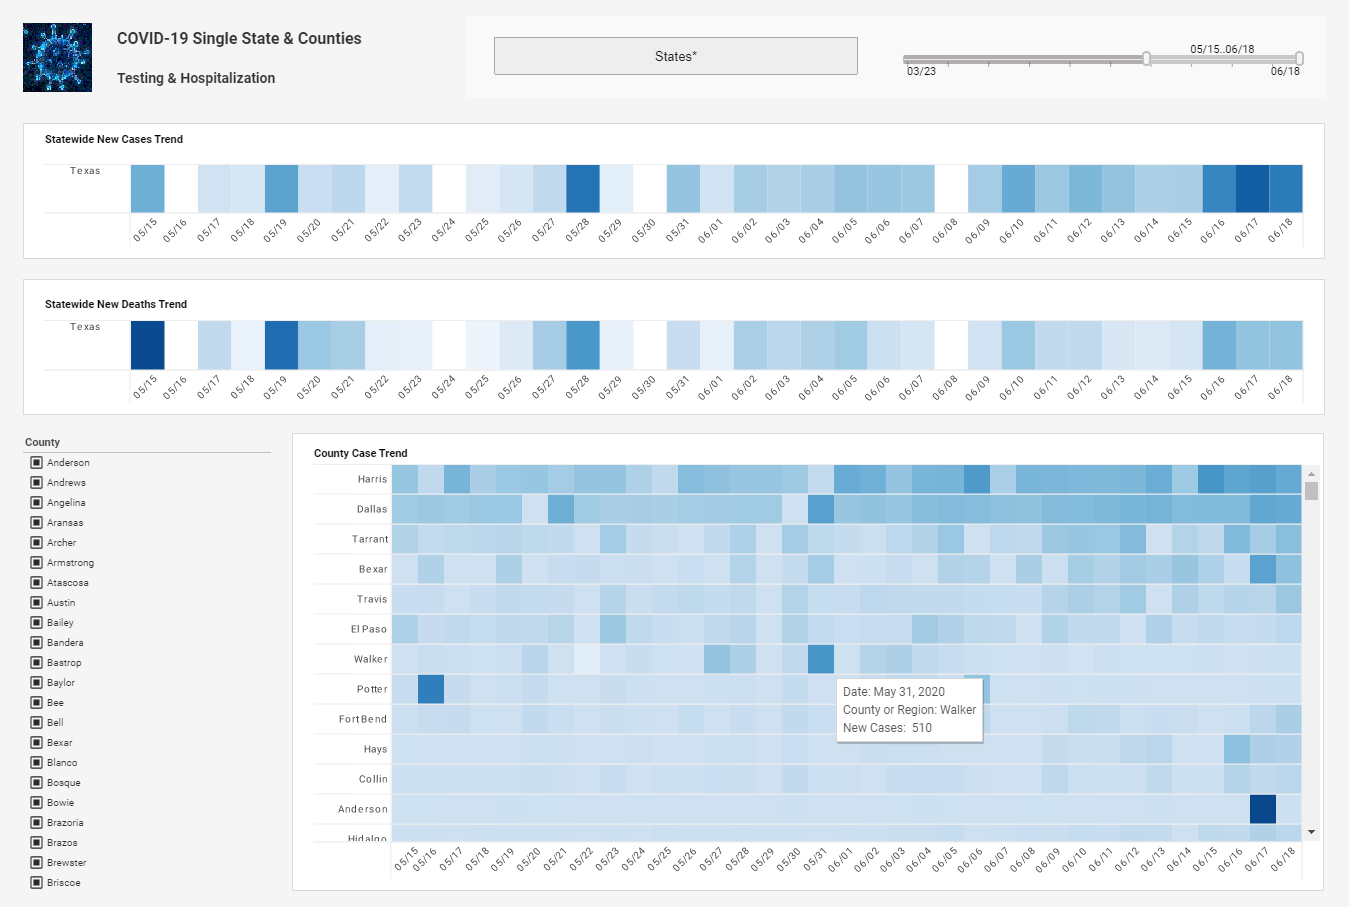
View live interactive examples in InetSoft's dashboard and visualization gallery. |
Enable business users to connect to new data sources, upload their own data, create their own reports and dashboards, carry out data exploration, and other relevant tasks
Connect data, uploading new data are basic functions in our solution. Our solution is designed with the philosophy that data exploration and manipulation are intertwined with visual reporting. It is designed to facilitate an iterative process of refining data and visualizing until answers are found.
We make the process extremely easy by having data and visual exploration built into one web interface. The outcome of this exercise is not only visual reports and dashboards but also well modeled data blocks. These data blocks naturally form a set of live data models that can be reused and mashed up for more than the original reports.
Capabilities such as data discovery, faceted navigation, guided navigation (report-building wizards or similar), autosuggestions for visualizations
Beyond parameter driven reports, our report wizard offers guided ad hoc reporting that requires no training. The charting component automatically picks visualization types for users and allows manual chart type selection as well. Our Data Block technology inherently is non-hierarchical . That enables users to explore for data discovery through facilitated navigation.
Provide Data Visualization capabilities
Features and functions such as availability of cockpit gauges, support for multiple graphs and chart types, support for Tufte's microcharts, ability to create or import custom charts
Gauges and shapes are among many others in our visualization tool set. Charting is the central and most powerful visualization component. Beyond standard charts, the application can render a grid of charts, charts with many dimensions, microcharts and overlaying chart types. If such visualization needs further customization, almost anything can be made with a small script.
 |
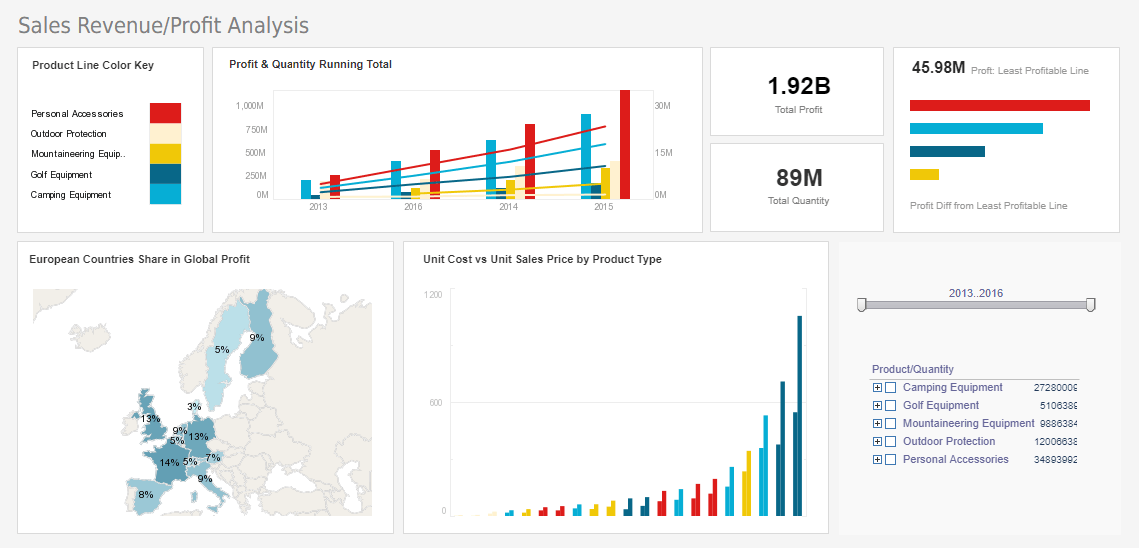
View a 2-minute demonstration of InetSoft's easy, agile, and robust BI software. |
Support for accessibility requirements
Features to support visually impaired users (auto-generating content for colorblind individuals, Braille readers, and text-to-speech readers). See https://www.section508.gov/ for additional information.
Our Bi software is compliant for accessibility requirements and is in use by numerous government agencies in public applications.
Provide access through mobile devices
Integration with on-device apps
Dashboards and reports may be accessed through browsers on mobile devices. For integration the on-device apps can serve HTML pages (the dashboards and reports) within the app
Provide predefined BI on BI reports or dashboards available to customers
BI on BI reports and dashboards are built-in and fully accessible through mobile devices.
Provide access to reports and dashboards on mobile devices such as tablets and smartphones
Our mobile mode enables design specifically for mobile layout. Additionally, the responsive design HTML5 output will automatically adjust to the form factor of a mobile device to provide a pleasant user experience.
Support for animations and rich visual queries as well as gestural interaction, integration with on-device apps
Animations can be included into the dashboard experience to provide that rich visual experience. Rich visual gestural support on mobile device gives the same level of control and interaction as on a desktop.
 |
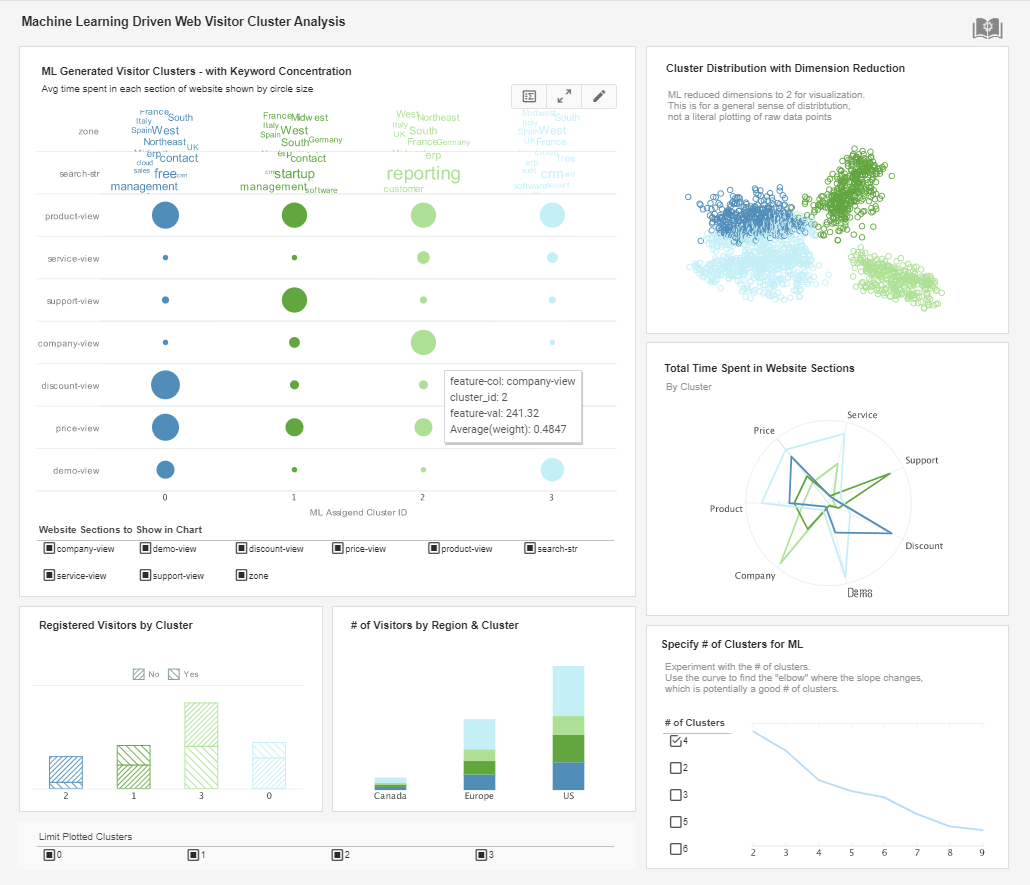
Read how InetSoft was rated as a top BI vendor in G2 Crowd's user survey-based index. |
Provide BI on BI capabilities
Provide BI on BI or usage analytics features and capabilities
Our solution includes comprehensive usage analytics. Once turned on, all actions, log-ins, and dependencies are logged within an auditing database. This will give administrators the information to manage and fine tune systems.
Provide predefined BI on BI reports or dashboards available to customers
There is a library of predefined reports that are available within the administrative interface to report on the auditing information gathered. With auditing there is also the availability to connect to the audit data as a data source within the tool and create customized dashboards and reports.
Requirements for the BI Systems Implementation Partner
Successful track record of implementing several BI solutions to clients across sectors, including retail and NPO sectors
This includes experience in implementing BI platforms across several, data warehouse platforms, performance management, predictive/advanced analytics, ETL, Hadoop/big data platforms
We have successfully implemented our BI solutions for customers in NGOs and NPOs, retail, school districts, UN agencies, governments, banking, and global logistics companies, to name a few. These successful implementations used varied data sources from legacy data marts to commercial row-based and columnar data warehouses offered by vendors like Oracle, Vertica, and Microsoft. Many projects have the need for ETL, predictive analytics and other advanced data science components. Through these engagements, we have become a key enabler for performance management, operation optimization and other platforms.
Recent implementations leverage open-source Big Data platforms such as Hadoop, Spark, as well as commercial offerings such as Cloudera Impala. A recent successful implementation was in the banking industry where we worked closely with the Data Warehouse department to help develop a Data Governance Portal where terms used by different departments are defined in contextual terms, and the BI solution is used to identify terms with similar meanings for a feedback loop.
Our data stewards performs an in-depth data analysis review with the client's in-house data experts to understand and formulate best practices for the ETL process, utilizing COTS products for the ETL process whenever possible. With legacy data sources, we can easily make use of our extensible modules to minimize customization efforts. We also have implementations that connect to R server for advanced, fast data analytics and predictive analytics
 |
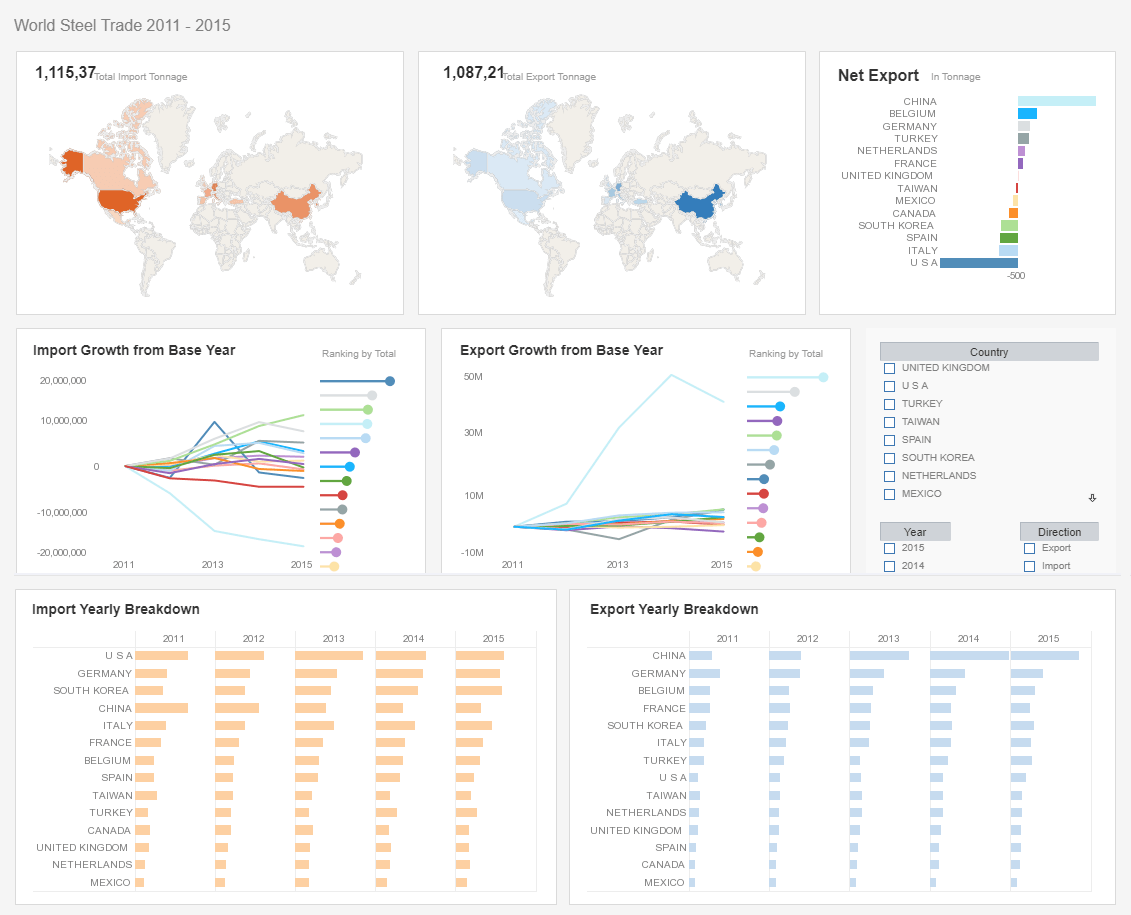
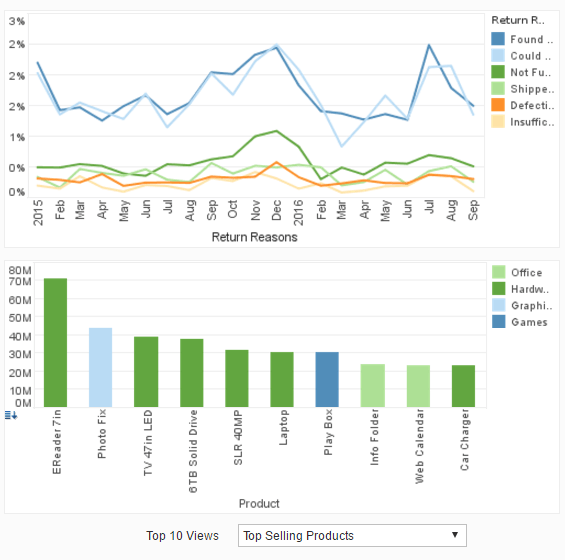
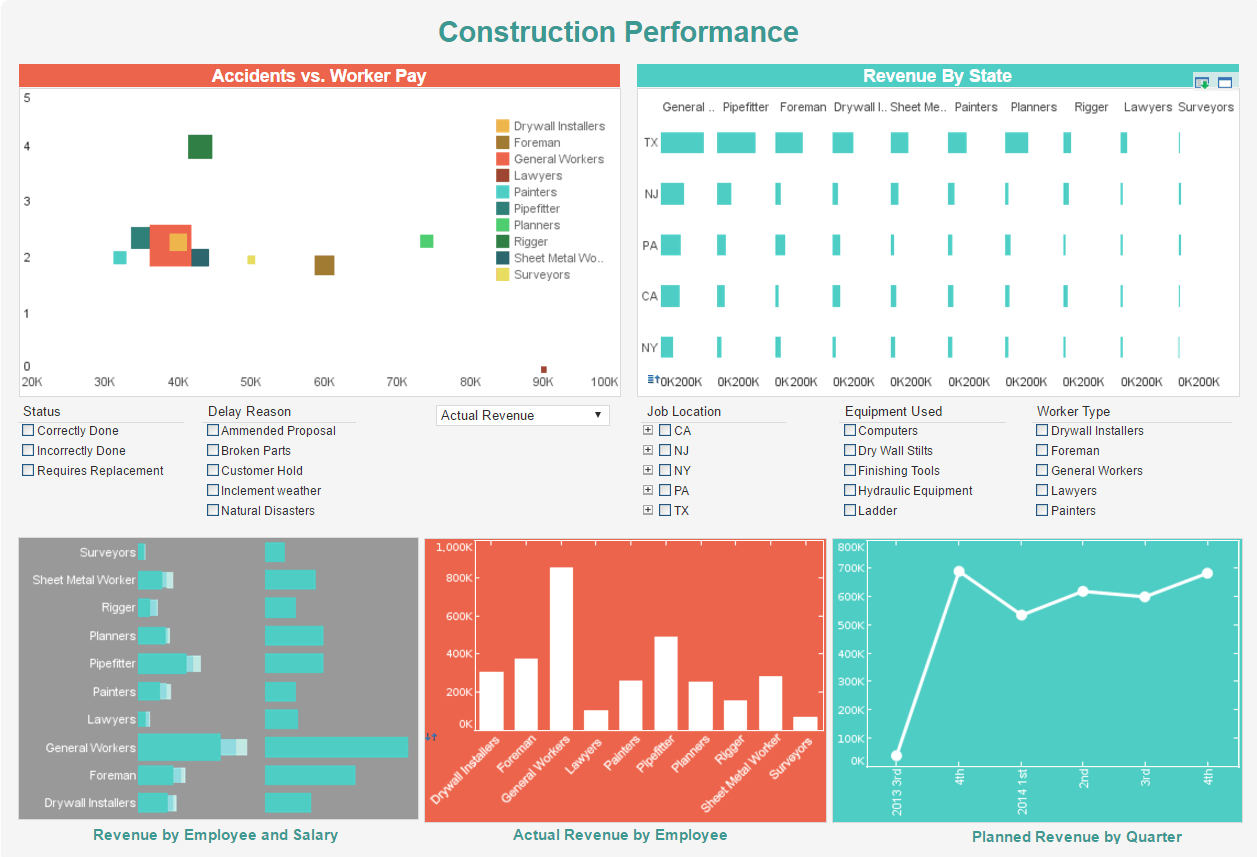
Read the top 10 reasons for selecting InetSoft as your BI partner. |
Provide project/program management skills to successfully manage and deliver the program
Project and program management is an integrated part our turn-key service offering. Our experienced project managers and business analysts work closely together with the client to bring about industry best practices. They translate business requirements into actionable items and a project timeline that is reviewed on a weekly basis to ensure successful delivery. We also work together with the client as a team to mitigate issues with external clients and vendors. As with most projects, there are usually unforeseen external factors, and our team is very experienced in mitigating such issues.
For example, we worked with a state-wide school district to overhaul their reporting system and due to database performance issues after roll-out (where the production database is bogged down with the daily transactional data), we worked with the database vendor to come up with a low-impact mini datamart solution and modified the meta data definitions for the reports within a week to make sure that the system performed within expectations.
Members of our Professional Services Team have a comprehensive understanding of technologies as well as strong communication and leadership skills in program management. Our program managers are skilled in understanding and communicating the overhaul strategy to internal and external stakeholders, planning, organizing, leading and the management of the team. Our program manager's role is strategic in nature, and he or she plays an essential role in managing the implementation of the strategic goals of our client by ensuring that the mission is achieved through the execution of the various programs they direct.
Our project managers lead the work of inter-related projects to ensure alignment of the individual projects, processes while mitigating risk to the goals of the program.
In the end, we have become a closely relied upon partner to our clients providing continuous support. In many instances, we have become the more knowledgeable experts on our customer's platform than their in-house team and trained generations of in-house staff.
Successful track record of affecting organization wide change and data-driven transformation
Vendor shall have experience in change management to ensure they can work with stakeholders across different organizations to successfully implement BI solutions
From the onset of the project, our BA team works closely with a focus group from the target audience (end-users) to make sure that user expectations are translated into actionable technical objectives as part of our change management strategy. Part of this strategy also requires follow-up discussions with the target audience at critical phases of the project, such as a walkthrough when the interface is completed to make sure that it fulfills the usage pattern.
We strongly recommend that the target audience participate in the QA and staging test phases. We will also have a team that will work with the stakeholders post-go live deployment to ensure a successful adoption rate. Our experience shows that user buy-in is the key factor in adoption. Once key influencers begin to champion a data driven business model, the project will grow and thrive.
Well-qualified team of BI, data management, project management and change management experts to develop and implement the solution
InetSoft's professional services team is always multi-disciplined. It is common for our customers to utilize a mixture of our talents from BI experts, data scientists, developers, and project managers. These expert teams always actively engage with customer staff to push forward the project. Key members have certifications for data management and are PMO-certified. All our engineering team comes from computer science backgrounds and have accumulated years' experience before starting on customer projects. As explained in 2a above, we have a change management strategy that has a proven track record in multiple BI implementations over the years.
Training development and rollout experience to ensure they can train key stakeholders across GII and members, adopting a train the trainer approach
Most clients benefit from train-the-trainer sessions. We recommend the best training path with a combination of class room, web and hands-on mentoring. We believe it benefits our clients to fully take ownership of our solution and we highly recommend training as well as train the trainer approach for larger deployments spanning multiple locations.
 |
Learn about the top 10 features of embedded business intelligence. |
Standard tools, frameworks, methodologies, prebuilt solution accelerators, and products to accelerate delivery
We are believers of open standards and the open source community. The following is a sample of what we most frequently use:
Tools used - Ant, Gradle, Maven, Kettle, Hadoop, Spark, Nifi, Informatica, R
Frameworks used - Java EE, Spring MVC, JSF, SpringBoot, Struts, node.JS, Angular 1 & 2, Bootstrap
Methodologies used - Agile, Scrum
COTS solution accelerators used - TestComplete, Selenium
Products to accelerate delivery - JMeter for load/stress-testing, JUnit for unit tests
Experience with partnering with firms to provide BI-managed services and BI SaaS services
For BI-managed services and BI SaaS Services, InetSoft has experience partnering with Amazon, Microsoft, Rackspace and IBM. We help our customers to select the most efficient offering for their cloud infrastructure, setup the environment, performance tune it, and monitor it. Often times, we have become the de-facto BI department online for our clients.
 |
Read how InetSoft saves money and resources with deployment flexibility. |
Summary
InetSoft's data intelligence solution is supported by two pillars: maximize self-service for users of all skill levels and minimize technical skill barriers for advanced intelligence Maximum self-service is made possible by fine grained self-service tools. Users of every skill level can find a tool to get started. As users' experience grows, it is easy to step up to next level. Also, these tools are web apps which only require the user to click and launch in browser.
- Guided basic reporting- parameter driven and nested prompting
- Guided ad-hoc reporting – report/query wizard
- Designed analytics - interactive visualization
- Ad-hoc analytics – data mashup/visualization composer
Elaboration of BI RFI Items
Agile and Scrum
Agile methodologies prioritize flexibility and customer satisfaction by delivering small, incremental updates frequently, allowing for continuous feedback and adjustments. Scrum, a popular Agile framework, structures work into sprints, typically lasting two to four weeks, where cross-functional teams focus on delivering a potentially shippable product increment. Key Scrum practices include daily stand-up meetings, sprint planning, and retrospective sessions, fostering collaboration, transparency, and continuous improvement. Together, Agile and Scrum methodologies enhance project management by ensuring teams remain adaptive and responsive to changing requirements and stakeholder needs.
Ad-hoc Analytics
Ad-hoc analytics with a data mashup and visualization composer enables users to blend data from multiple sources and create custom visual representations on the spot. This flexibility allows for real-time data integration and the creation of comprehensive views, highlighting correlations and trends that might not be visible in isolated datasets. Users can design tailored visualizations, combining various chart types and filters, to explore data from different perspectives and derive actionable insights. The data mashup and visualization composer make ad-hoc analytics a powerful tool for uncovering hidden patterns and driving informed decision-making.
COTS Solution Accelerators
COTS (Commercial Off-The-Shelf) solution accelerators are pre-built software components or frameworks designed to expedite the deployment and integration of enterprise solutions. These accelerators reduce development time and costs by providing ready-made functionalities, allowing organizations to quickly implement and customize software to meet their specific needs. By leveraging COTS solutions, businesses can focus on refining their unique processes and requirements rather than building foundational elements from scratch. This approach enhances efficiency, minimizes risks, and ensures faster time-to-market for new systems and applications.
Designed Analytics
Designed analytics with interactive visualization transforms raw data into engaging and comprehensible visual formats, such as charts, graphs, and dashboards. Users can interact with these visual elements to drill down into details, adjust filters, and uncover insights that static reports might obscure. This dynamic approach facilitates a deeper understanding of trends and patterns, making it easier to identify correlations and anomalies. Ultimately, interactive visualization empowers decision-makers to make data-driven decisions quickly and confidently, as they can explore and interpret data in real-time.
Guided Ad-hoc Reporting
Guided ad-hoc reporting using a report/query wizard empowers users to create custom reports on the fly without needing extensive technical knowledge. The wizard walks users through a step-by-step process, allowing them to select data sources, define filters, and choose display formats effortlessly. This guided approach ensures that even those unfamiliar with complex querying can generate precise and relevant reports tailored to their specific needs. By simplifying the report creation process, the report/query wizard enhances accessibility and efficiency, enabling quicker access to valuable insights.
Guided Basic Reporting
Guided basic reporting, driven by parameters, allows users to create reports by selecting specific criteria or filters, which dynamically adjusts the output to meet their needs. This approach simplifies the reporting process by enabling users to input parameters like date ranges, regions, or product categories, ensuring that the generated reports are relevant and precise. Nested prompting takes this a step further by offering a series of interdependent prompts, where each subsequent prompt is determined by the previous selections, enhancing the customization and granularity of the report. Together, these features make reporting more intuitive and efficient, reducing the need for extensive manual data manipulation.
JMeter and JUnit
JMeter is an open-source tool specifically designed for load and stress testing web applications, helping to evaluate performance under various conditions and identify potential bottlenecks. It simulates multiple users accessing a service simultaneously, providing detailed reports on response times, throughput, and resource utilization, which are crucial for optimizing system performance. JUnit, on the other hand, is a widely-used framework for writing and running unit tests in Java, ensuring that individual components of the software function correctly. By automating the execution of tests and providing immediate feedback on code quality, JUnit helps developers maintain high standards and quickly identify and fix bugs. Both JMeter and JUnit are integral to a robust testing strategy, ensuring that applications are both scalable and reliable. Together, they contribute to the overall quality assurance process, enhancing the stability and efficiency of software systems before they go live.
Target Audience Participation
Involving the target audience in the QA and staging test phases ensures that the product meets real user needs and expectations before its final release. These users provide invaluable feedback on functionality, usability, and potential issues, which might not be identified by internal testing teams alone. Their participation helps to validate that the product works effectively in real-world scenarios and under various conditions. Ultimately, this approach enhances the product's quality and user satisfaction by addressing genuine user concerns and preferences early in the development process.
Train the Trainer Approach
The train the trainer approach involves educating key individuals within an organization to become proficient trainers themselves, enabling them to pass on their knowledge and skills to other employees. This method ensures that training is scalable and sustainable, as trained trainers can continuously educate new staff or refresh existing employees' skills. It fosters internal expertise and creates a self-sufficient learning environment, reducing dependency on external trainers and consultants. Additionally, the approach promotes consistency in training delivery, as in-house trainers are well-acquainted with the organization's specific needs and culture.
| Previous: Business Intelligence RFP Template |
