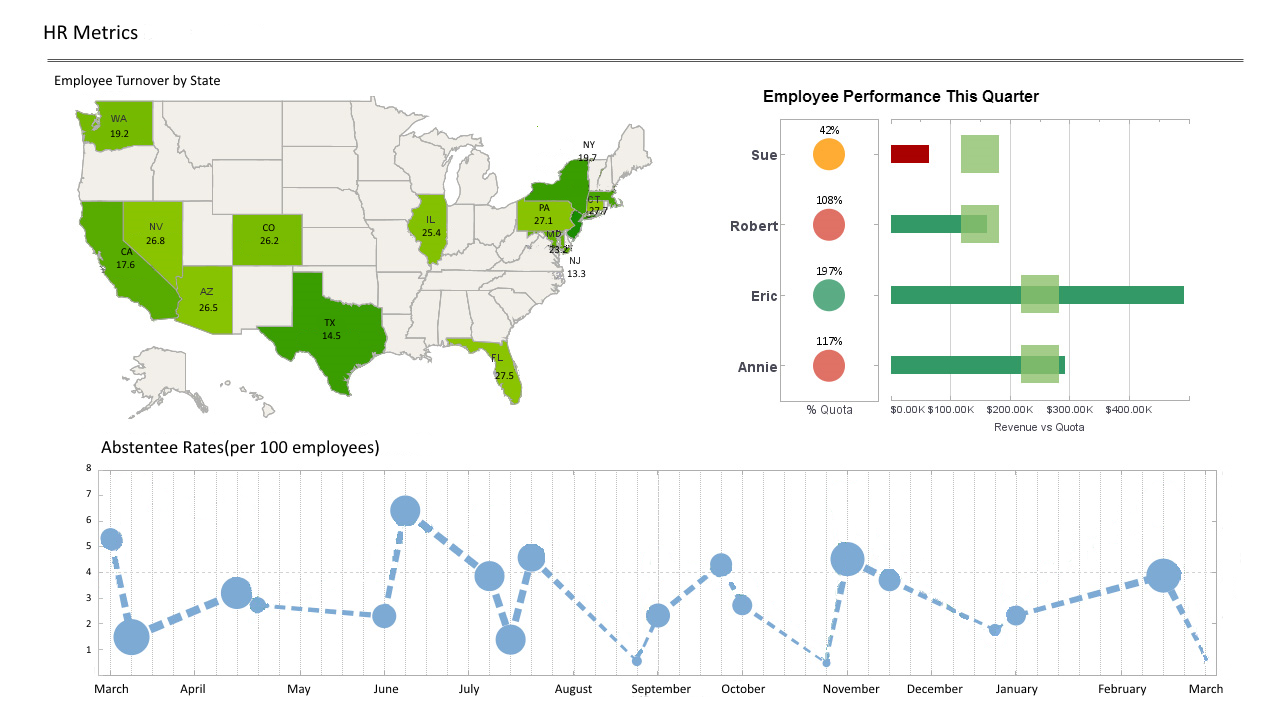
InetSoft's Chart API Platform to Create Charts for Your Web Application
Looking for a Chart API to create charts Web application? InetSoft offers an API in its commercial software, Style Intelligence, with some of the documentation presented below. In addition free versions for drag and drop design of advanced charts are available.
The Start Free button gives you two options for using InetSoft's free dashboard visualization software. For the Individual Account choice, register with any email address, including free email services such as Google and Yahoo. There is no credit card required. Use the 100% web app with no desktop install. Collaborate online in real time. Use data sources such as uploaded Excel or CSV files or connect to live Google sheets. Publicly share dashboards, if you wish, via URL link. All advanced data visualization types and interactive controls are available.
GradientColorFrame.setFromColor(value), GradientColorFrame.fromColor
Specifies the starting color (for lowest value) of the gradient.
Type (Report Script)
java.awt.Color          e.g., java.awt.Color.BLUE
number (hex)            e.g., 0xFF0000
string (color name)     e.g., 'red'
array [r,g,b]           e.g., [255,0,0]
JSON {r:#,g:#,b:#}      e.g., {r:255,g:0,b:0}
Parameter
value
 a java.awt.Color object
Example (Report)
Bind a bar-type chart to the sample 'All Sales' query, with 'Company' (top 5) on the X-axis, and Sum(Total) on the Y-axis. Add the following script in the onLoad Handler.
importPackage(inetsoft.graph.aesthetic);
Graph1.bindingInfo.setColorField("Total",Chart.NUMBER);
Graph1.bindingInfo.colorFrame = new GradientColorFrame;
Graph1.bindingInfo.colorFrame.fromColor = 0x0000FF;
Graph1.bindingInfo.colorFrame.toColor = 0xFF00FF;
Example (Report or Viewsheet)
importPackage(inetsoft.graph)
importPackage(inetsoft.graph.element)
importPackage(inetsoft.graph.scale)
importPackage(inetsoft.graph.aesthetic)
importPackage(inetsoft.graph.data)

var arr = [["State", "Quantity"],
           ["NJ",200],["NY",300],["PA",50],["CT",100]];
dataset = new DefaultDataSet(arr);
graph = new EGraph();
var elem = new IntervalElement("State", "Quantity");
var frame = new GradientColorFrame();
frame.setFromColor(java.awt.Color(0x000000));
frame.setToColor(java.awt.Color(0xff0000));
frame.setField("Quantity");
elem.setColorFrame(frame);
graph.addElement(elem);

| #1 Ranking: Read how InetSoft was rated #1 for user adoption in G2's user survey-based index | Read More |
GradientColorFrame.setToColor(value), GradientColorFrame.toColor
Specifies the ending color (for highest value) of the gradient.
Type (Report Script)
java.awt.Color          e.g., java.awt.Color.BLUE
number (hex)            e.g., 0xFF0000
string (color name)     e.g., 'red'
array [r,g,b]           e.g., [255,0,0]
JSON {r:#,g:#,b:#}      e.g., {r:255,g:0,b:0}
Parameter (Element Script)
value
 a java.awt.Color object
Example (Report)
Bind a bar-type chart to the sample 'All Sales' query, with 'Company' (top 5) on the X-axis, and Sum(Total) on the Y-axis. Add the following script in the onLoad Handler.
importPackage(inetsoft.graph.aesthetic);
Graph1.bindingInfo.setColorField("Total",Chart.NUMBER);
Graph1.bindingInfo.colorFrame = new GradientColorFrame;
Graph1.bindingInfo.colorFrame.fromColor = 0x0000FF;
Graph1.bindingInfo.colorFrame.toColor = 0xFF00FF;
Example (Report or Viewsheet)
importPackage(inetsoft.graph)
importPackage(inetsoft.graph.element)
importPackage(inetsoft.graph.scale)
importPackage(inetsoft.graph.aesthetic)
importPackage(inetsoft.graph.data)
var arr = [["State", "Quantity"],
           ["NJ",200],["NY",300],["PA",50],["CT",100]];
dataset = new DefaultDataSet(arr);
graph = new EGraph();
var elem = new IntervalElement("State", "Quantity");
var frame = new GradientColorFrame();
frame.setFromColor(java.awt.Color(0x000000));
frame.setToColor(java.awt.Color(0xff0000));
frame.setField("Quantity");
elem.setColorFrame(frame);
graph.addElement(elem);
 |
View live interactive examples in InetSoft's dashboard and visualization gallery. |
HeatColorFrame
The HeatColorFrame object contains a continuous color frame that returns varying shades of brown. To create a HeatColorFrame object, call the HeatColorFrame constructor.
importPackage(inetsoft.graph.aesthetic);
var frame = new HeatColorFrame('Quantity');
You can pass the name of a field (e.g., 'Quantity') to the constructor, or specify this later using the inherited VisualFrame.setField(field) property.
Example (Report)Bind a bar-type chart to the sample 'All Sales' query, with 'Company' (top 5) on the X-axis, and Sum(Total) on the Y-axis. Add the following script in the onLoad Handler.
importPackage(inetsoft.graph.aesthetic);
Graph1.bindingInfo.setColorField("Total",Chart.NUMBER);
Graph1.bindingInfo.colorFrame = new HeatColorFrame();
Example (Report or Viewsheet)
importPackage(inetsoft.graph)
importPackage(inetsoft.graph.element)
importPackage(inetsoft.graph.scale)
importPackage(inetsoft.graph.aesthetic)
importPackage(inetsoft.graph.data)

var arr = [["State", "Quantity"],
           ["NJ",200],["NY",300],["PA",50],["CT",100]];
dataset = new DefaultDataSet(arr);
graph = new EGraph();
var elem = new IntervalElement("State", "Quantity");
var frame = new HeatColorFrame();
frame.setField("Quantity");
elem.setColorFrame(frame);
 |
View live interactive examples in InetSoft's dashboard and visualization gallery. |
RainbowColorFrame
The RainbowColorFrame object contains a continuous color frame that returns colors of the rainbow. To create a RainbowColorFrame object, call the RainbowColorFrame constructor.
importPackage(inetsoft.graph.aesthetic);
var frame = new RainbowColorFrame('Quantity');
You can pass the name of a field (e.g., 'Quantity') to the constructor, or specify this later using the inherited VisualFrame.setField(field) property.

Example (Report)
Bind a bar-type chart to the sample 'All Sales' query, with 'Company' (top 5) on the X-axis, and Sum(Total) on the Y-axis. Add the following script in the onLoad Handler.
importPackage(inetsoft.graph.aesthetic);
Graph1.bindingInfo.setColorField("Total",Chart.NUMBER);
Graph1.bindingInfo.colorFrame = new RainbowColorFrame;
Example (Report or Viewsheet)
importPackage(inetsoft.graph)
importPackage(inetsoft.graph.element)
importPackage(inetsoft.graph.scale)
importPackage(inetsoft.graph.aesthetic)
importPackage(inetsoft.graph.data)

var arr = [["State", "Quantity"],
           ["NJ",200],["NY",300],["PA",50],["CT",100]];
dataset = new DefaultDataSet(arr);
graph = new EGraph();
var elem = new IntervalElement("State", "Quantity");
var frame = new RainbowColorFrame();
frame.setField("Quantity");
elem.setColorFrame(frame);
graph.addElement(elem);
Learn how InetSoft's data intelligence technology is central to delivering efficient business intelligence. |
CategoricalColorFrame
The CategoricalColorFrame object contains a color frame that returns a distinct color for each unique value in the bound field. To create a CategoricalColorFrame object, call the CategoricalColorFrame constructor.
importPackage(inetsoft.graph.aesthetic);
var frame = new CategoricalColorFrame('State');
You can pass the name of a field (e.g., 'State') to the constructor, or specify this later using the inherited VisualFrame.setField(field) property.
Example (Report)
Bind a bar-type chart to the sample 'All Sales' query, with 'Company' (top 5) on the X-axis, and Sum(Total) on the Y-axis. Add the following script in the onLoad Handler.
importPackage(inetsoft.graph.aesthetic);
Graph1.bindingInfo.setColorField("Employee",Chart.STRING);
Graph1.bindingInfo.colorFrame = new CategoricalColorFrame;
Example (Report or Viewsheet)
importPackage(inetsoft.graph)
importPackage(inetsoft.graph.element)
importPackage(inetsoft.graph.scale)
importPackage(inetsoft.graph.aesthetic)
importPackage(inetsoft.graph.data)

var arr = [["State", "Quantity"], ["NJ",20], ["NY",40]];
dataset = new DefaultDataSet(arr);
graph = new EGraph();
var elem = new IntervalElement("State", "Quantity");
var frame = new CategoricalColorFrame();
frame.setField("State");
elem.setColorFrame(frame);
graph.addElement(elem);
| Previous: How to Make a Web Chart |


