InetSoft Product Information: Chart Generator
InetSoft offers a free online chart generator called Visualize Free and a commercial server-based chart generator called Style Intelligence.
Style Intelligence is a commercial business intelligence software package for enterprise chart generation and real-time access to almost any data source. This software is also well-suited for developers to embed into other applications, on-premise or SaaS-based.
View a demo, try them out for free, and register for a personalized demo.
SunShapeFrame
The SunShapeFrame object contains the shape styles for multidimensional “sun” (radial line) elements. To create a SunShapeFrame object, call the SunShapeFrame constructor.
var range = new SunShapeFrame("m1","m2","m3");
You can pass a set of field names (e.g., 'm1', 'm2', 'm3') to the constructor, or specify this later using the inherited MultiShapeFrame.setFields(arr) property.
Example (Report or Viewsheet)
importPackage(inetsoft.graph)
importPackage(inetsoft.graph.element)
importPackage(inetsoft.graph.scale)
importPackage(inetsoft.graph.aesthetic)
importPackage(inetsoft.graph.data)

var arr = [["State", "Quantity","m1","m2","m3"],
           ["NJ", 200,5,1,3], ["NY", 300,3,4,4]];
dataset = new DefaultDataSet(arr);
graph = new EGraph();
var frame = new SunShapeFrame();
var elem = new PointElement("State", "Quantity");
frame.setFields(["m1","m2","m3"]);
elem.setShapeFrame(frame);
graph.addElement(elem);

BarShapeFrame
The BarShapeFrame object contains the shape styles for multi-dimensional “mini-bar chart” elements. To create a BarShapeFrame object, call the BarShapeFrame constructor.
var range = new BarShapeFrame("m1","m2","m3");
You can pass a set of field names (e.g., 'm1', 'm2', 'm3') to the constructor, or specify this later using the inherited MultiShapeFrame.setFields(arr) property. The dimensions are mapped to the bars heights from left to right.
Example (Report or Viewsheet)
importPackage(inetsoft.graph)
importPackage(inetsoft.graph.element)
importPackage(inetsoft.graph.scale)
importPackage(inetsoft.graph.aesthetic)
importPackage(inetsoft.graph.data)

var arr = [["State", "Quantity","m1","m2","m3"],
           ["NJ", 200,5,1,3], ["NY", 300,3,4,4]];
dataset = new DefaultDataSet(arr);
graph = new EGraph();
var frame = new BarShapeFrame();
var elem = new PointElement("State", "Quantity");
frame.setFields(["m1","m2","m3"]);
elem.setShapeFrame(frame);
graph.addElement(elem);
ProfileShapeFrame
The ProfileShapeFrame object contains the shape styles for multi-dimensional “mini-line chart” elements. To create a ProfileShapeFrame object, call the ProfileShapeFrame constructor.
var range = new ProfileShapeFrame("m1","m2","m3");
You can pass a set of field names (e.g., 'm1', 'm2', 'm3') to the constructor, or specify this later using the inherited MultiShapeFrame.setFields(arr) property. The dimensions are mapped to the line segments from left to right.
Example (Report or Viewsheet)
importPackage(inetsoft.graph)
importPackage(inetsoft.graph.element)
importPackage(inetsoft.graph.scale)
importPackage(inetsoft.graph.aesthetic)
importPackage(inetsoft.graph.data)


var arr = [["State", "Quantity","m1","m2","m3"],
           ["NJ", 200,5,1,3], ["NY", 300,3,4,4]];
dataset = new DefaultDataSet(arr);
graph = new EGraph();
var frame = new ProfileShapeFrame();
var elem = new PointElement("State", "Quantity");
frame.setFields(["m1","m2","m3"]);
elem.setShapeFrame(frame);
graph.addElement(elem);
TextFrame.setText(value,text)
Specifies the mapping between a value and the text that should be displayed.
Parameters
value
 the data value to be replaced
text
 the replacement string
Example (Report or Viewsheet)
importPackage(inetsoft.graph)
importPackage(inetsoft.graph.element)
importPackage(inetsoft.graph.scale)
importPackage(inetsoft.graph.aesthetic)
importPackage(inetsoft.graph.data)

var arr = [["State", "Quantity"], ["NJ",200], ["NY",300]];
dataset = new DefaultDataSet(arr);
graph = new EGraph();
var elem = new IntervalElement("State", "Quantity");
var cframe = new CategoricalColorFrame();
var tframe = new DefaultTextFrame();
var spec = cframe.getLegendSpec();
cframe.setField("State");
tframe.setText('NJ','New Jersey');
tframe.setText('NY','New York');
spec.setTextFrame(tframe)
elem.setColorFrame(cframe);
graph.addElement(elem);
DefaultTextFrame
The DefaultTextFrame object contains data to display in text form, as well as a mapping between these values and any desired replacement text. To create a DefaultTextFrame object, call the DefaultTextFrame constructor.
importPackage(inetsoft.graph.aesthetic);
var frame = new DefaultTextFrame('Quantity');
You can pass a field name (e.g., 'Quantity') to the constructor, or specify this later using the inherited VisualFrame.setField(field) property. To stylize or reposition text created using a DefaultTextFrame, use the GraphElement.setTextSpec(spec) and GraphElement.setLabelPlacement(value) options.
Example (Report)
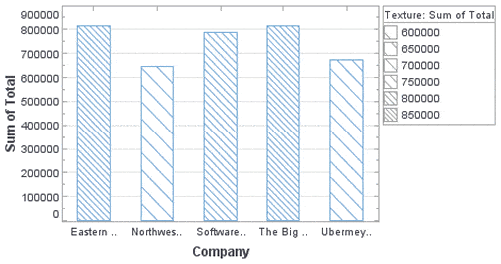
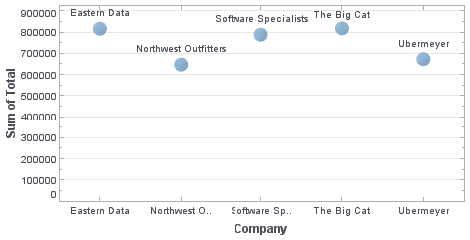
Bind a point-type chart to the sample 'All Sales' query, with 'Company' (top 5) on the X-axis, and Sum(Total) on the Y-axis. Add the following script in the onLoad Handler.
importPackage(inetsoft.graph.aesthetic);
Graph1.bindingInfo.setTextField("Company",Chart.STRING)
Graph1.bindingInfo.textFrame = new DefaultTextFrame;

Example (Report or Viewsheet)
importPackage(inetsoft.graph)
importPackage(inetsoft.graph.element)
importPackage(inetsoft.graph.scale)
importPackage(inetsoft.graph.aesthetic)
importPackage(inetsoft.graph.data)

var arr = [["State", "Quantity"], ["NJ",203], ["NY",327]];
dataset = new DefaultDataSet(arr);
graph = new EGraph();
var elem = new IntervalElement("State", "Quantity");
var spec = new TextSpec();
var frame = new DefaultTextFrame();
spec.setFont(java.awt.Font('Verdana',
   java.awt.Font.BOLD, 14));
frame.setField("Quantity");
elem.setTextFrame(frame);
elem.setTextSpec(spec);
graph.addElement(elem);
Example (Report or Viewsheet)
importPackage(inetsoft.graph)
importPackage(inetsoft.graph.element)
importPackage(inetsoft.graph.scale)
importPackage(inetsoft.graph.aesthetic)
importPackage(inetsoft.graph.data)

var arr = [["State", "Quantity"], ["NJ",200], ["NY",300]];
dataset = new DefaultDataSet(arr);
graph = new EGraph();
var elem = new IntervalElement("State", "Quantity");
var cframe = new CategoricalColorFrame();
var tframe = new DefaultTextFrame();
var spec = cframe.getLegendSpec();
cframe.setField("State");
tframe.setText('NJ','New Jersey');
tframe.setText('NY','New York');
spec.setTextFrame(tframe)
elem.setColorFrame(cframe);
graph.addElement(elem);
LineFrame
The LineFrame object contains the line design for visual chart objects. LineFrame objects allow you to represent additional data dimensions by using the physical attributes of chart elements, or to apply a fixed (static) line style.
Example (Report)
Bind a line-type chart to the sample 'All Sales' query, with 'Company' (top 5) on the X-axis, and Sum(Total) on the Y-axis. Add the following script in the onLoad Handler.
importPackage(inetsoft.graph.aesthetic);
Graph1.bindingInfo.setShapeField("Total",Chart.NUMBER);
Graph1.bindingInfo.lineFrame = new LinearLineFrame;
Example (Report or Viewsheet)
importPackage(inetsoft.graph)
importPackage(inetsoft.graph.element)
importPackage(inetsoft.graph.scale)
importPackage(inetsoft.graph.aesthetic)
importPackage(inetsoft.graph.data)

var arr = [["State", "Quantity"], ["NJ",200], ["NY",300], ["PA",100]];
dataset = new DefaultDataSet(arr);
graph = new EGraph();
var elem = new LineElement("State", "Quantity");
var frame = new StaticLineFrame();
frame.setLine(GLine.DASH_LINE);
elem.setLineFrame(frame);
graph.addElement(elem)

