InetSoft Product Information: Composite Dashboard Tables
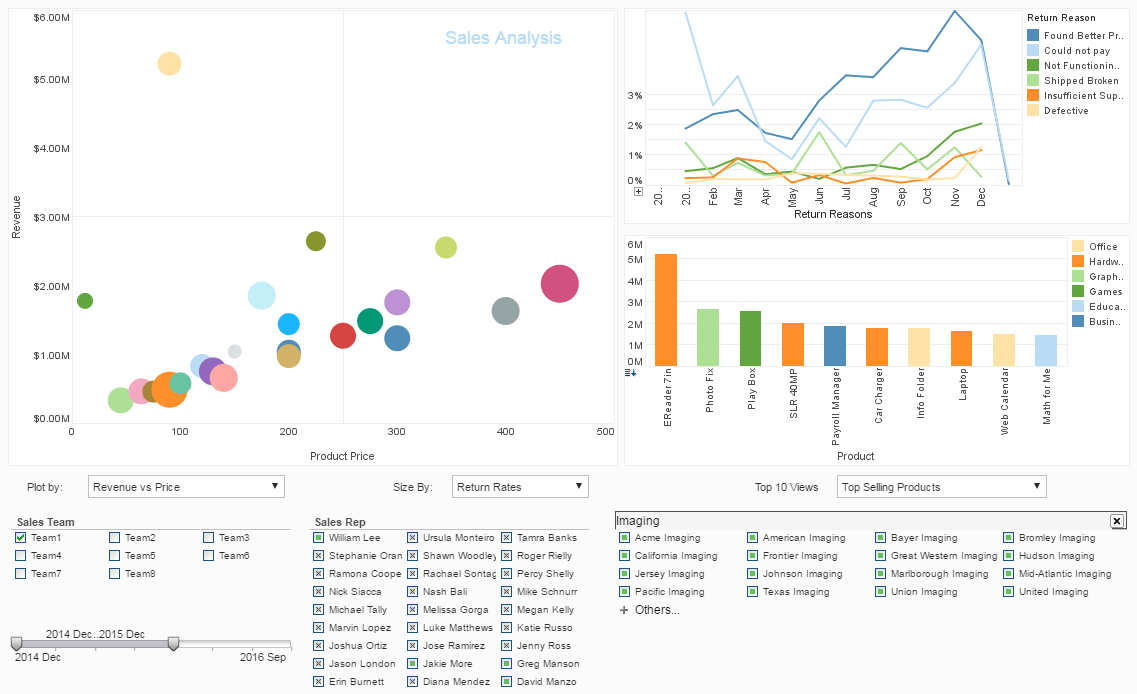
Users can create composite dashboard tables using InetSoft's award-winning dashboard software, an interactive data mashup reporting application that is available as a stand alone product or embeddable solution. View the data dashboard example below to learn more about the Style Intelligence solution.
When you select a Composition Table (Joined Table or Concatenated Table), the Worksheet displays a set of arrows that indicate the table's dependencies. For example, when you click on a Joined Table, the arrows indicate the two Data Blocks are joined to produce the selected table.
In some cases, you may need to change the source of a Composition Table after you have already created the table. For example, when you originally created the Composition Table, you might have used a source Data Block (e.g., Embedded Table) containing some prototype or placeholder data. Later, when the production data is available, you need to replace this prototype Data Block with the Data Block containing real data.
To change the source of a Composition Table from one Data Block to another, follow the steps below:
Note: The new Data Block must be compatible with the Data Block it replaces. See below.
| #1 Ranking: Read how InetSoft was rated #1 for user adoption in G2's user survey-based index | Read More |
1. Add the new (replacement) source Data Block to the Worksheet.
2. Click the Composition Table to select it. This displays the arrows that show the Composition dependencies.
3. Click the arrow that connects the Composition Table to the old source Data Block (the Data Block you wish to replace). This highlights the arrow.
4. Drag and drop the arrow over the new (replacement) Data Block.
This rebinds the Composition Table to the new (replacement) Data Block.
To preserve the existing composition operation with the replacement Data Block, the replacement Data Block must be compatible with old Data Block in the following manner:
• For a Joined Table, the name of the original join column must match a column name in the replacement Data Block in order to preserve the join. Otherwise, the resultant join type will default to a cross-join until you define a new relationship.
• For a Concatenated Table, the number of columns and the data types in the replacement Data Block must match the old Data Block.
More Articles About Dashboards
Advent of Machine Learning - The second key technology that makes data such a critical asset is the proliferation of machine learning algorithms for product associations and recommendations. Such algorithms have evolved from early "market basket" association learning to the sophisticated algorithms that guide YouTube recommendations and Facebook feeds to their users...
Avoiding Bottlenecks in Data Delivery - Talking all about avoiding bottlenecks in data delivery and data access, to Jim's point, the consumption side, business users want information, and they get spoiled right? When you get the information you want, you get real happy, and then when you don't get it, if somebody changes a process, and now you are not getting that data feed anymore that can be rather disruptive I am sure.
Data Visualization Concepts - Data visualization is not a new discipline. The basic concepts of how to effectively present information through graphs have been well established in the 1970's. In the simplest case, the principle of data visualization is about how to design graphs to communicate. Let's illustrate this through an example. The graph on the left is an example from a reporting software vendor's site...
How to Export Dashboards to Excel - A spreadsheet is a popular tool for performing simple data analysis. It also has fairly strong formatting support. InetSoft products support exporting a report to an Excel file. The Excel export is based on report layout and the following two assumptions: • The generated Excel file contains the actual data in the report, so it can be further manipulated in a spreadsheet application. • The Excel file should match the report layout and formatting as closely as possible, so it can be printed out in a form that reasonably resembles the original report...
Quick Business Intelligence - Today we are talking about "Is Quick Business Intelligence Better Business Intelligence?" And you may notice that I have taken the liberty to add a small question mark to the end of that title which is not in the original, and the reason I have done that will become clear as we go through the presentation. So let's get moving...
You're Getting a Lot More Data - You can point that at not directly Hadoop, but you can point it to a PowerPivot model or in analysis services tabular model that pulls data from Hadoop. PowerPivot, most parts of the BI stack can get to it, though the notable exception is the multidimensional mode of SQL Server Analysis Services. Stepping back for a moment now, Big Data came into my life really from reading about it. I was aware of it, and I explored it, and it turned out to be the next face of BI. Technologically the worlds are a little bit different, and I would say even culturally they're little different. A lot of the practitioners in the Big Data world have never really done work with conventional BI technology and vice versa...
| Previous: Editing Dashboard Tables |
Next: Live Data Dashboard
|


