The Dashboard Data Worksheet
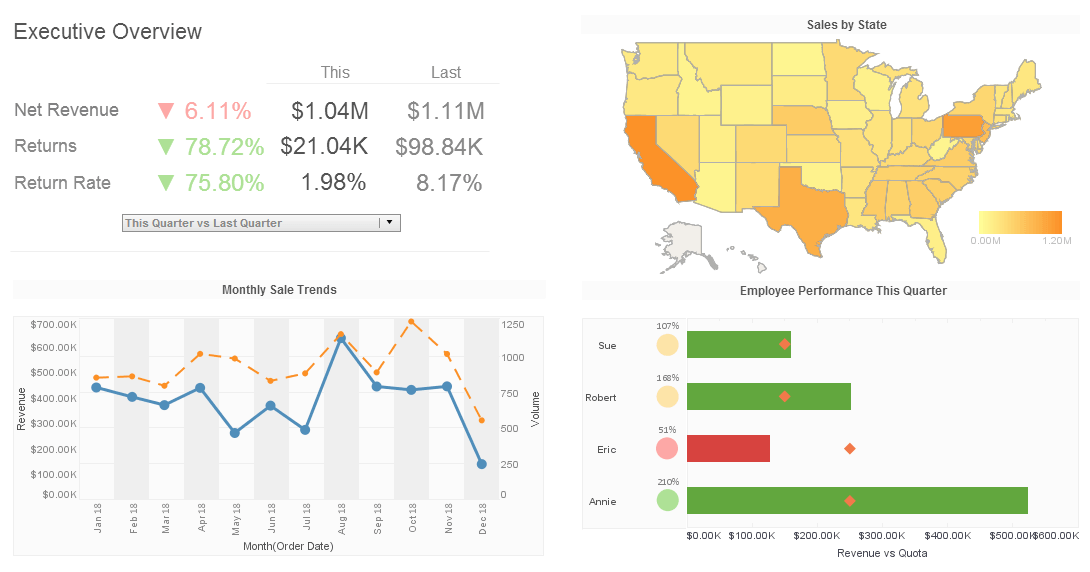
InetSoft's dashboard software provides a sophisticated tool known as a data worksheet that allows users to manipulate, transform, and mashup disparate data sets. View the example below to learn more about the Style Intelligence solution
The Data Worksheet is a powerful and easy-to-use tool that enables you to rapidly build complex queries for demanding tasks such as “what-if” and cross-domain analysis. This guide explains everything you need to know about using Worksheets, covering the following major topics.
You can create and edit Worksheets using either the desktop Asset Composer or the web-based Visual Composer. The Asset Composer and Visual Composer have identical functionality, although there are some minor differences in appearance. Both tools save assets to the same location, and both have access to the same saved assets.
You can use either tool to create and edit Worksheets. Developers may find it more convenient to work with the desktop Asset Composer, while Viewsheet users may find it more convenient to work with the web-based Visual Composer.
Opening the Data Worksheet
There are several ways to launch the desktop Asset Composer.
1. To launch the Asset Composer from the Windows 'Start' menu, select 'Asset Composer' from the 'Style Intelligence' folder (under 'Programs').
2. To launch the Asset Composer from Report Designer, select 'Asset Composer' from the Designer toolbar. (See the Report Designer for information about using the Designer.)
3. To launch the Asset Composer from the command line, type the following: java inetsoft.util.gui.Main modeler
Once you have launched the Asset Composer, you can create new Worksheets or open existing Worksheets for editing. To launch the web-based Visual Composer, follow these steps:
1. Open a web browser, and log in to the Report Portal.
2. Click the Design tab at the top of the Report Portal.
3. Click the 'Visual Composer' link under the Design tab. This launches the Visual Composer in a separate browser window. Once you have launched the Visual Composer, you can create new Worksheets or open existing Worksheets for editing.
More Articles About Dashboards
Analysis Tools for the Physicians' Office Manager - A Physician's Office Manager plays a crucial role in ensuring the smooth operation of a medical practice. They can leverage various business analysis tools to enhance efficiency, improve patient care, and drive financial success. Here's a detailed exploration of how a Physician's Office Manager can use business analysis tools: Revenue Cycle Analysis: Purpose: This tool helps in tracking the financial performance of the practice by analyzing the revenue generated through patient visits, services, and procedures...
Cloud and Turnkey Appfigures Dashboards - Cloud based Appfigures dashboards and reports offer instant snapshots of application key performance indicators (KPIs) and provide real time trend reporting, with the freedom of ad hoc editing. Users gain a clearer understanding of app performance and what will help grow the apps usage or help their department build a better one. Because of drill down capability, users can move from a summary level of data down into greater detail, allowing them to really get to the root of pressing issues. Users can even create dashboards on an ad-hoc basis, without needing an IT administrator. They can customize and format data to their liking, modifying reports to aid in any business decision...
Overall Yard Efficiency KPIs - Turnaround Time The time it takes a truck or trailer to arrive at the yard, do its job, then leave is known as the turnaround time. Improved yard operations efficiency is shown by a shorter turnaround time. This KPI is often shown in real-time on YMS dashboards, enabling managers to see bottlenecks and put improvement plans into action. Resource Utilization To save expenses and increase production, yard resources must be used effectively. KPIs related to resource consumption, such as manpower, equipment, and yard area use, are monitored using YMS dashboards. Chart visualization makes it possible to quickly identify unused resources and make proactive improvements...
Performance Indicators Become Red - But when Jack's performance indicators become red because of customer complaints, he doesn't care about thousands of courses. All he cares about are those specific courses that he might take in the next day or week that could help him and his team improve the situation with customer complaints. In TFI Consulting, we have hundreds of discussion forums that involve consultants from around the world talking on hundreds of different topics. I can even join those discussion forums, and get expert advice from people around the world anytime I want...

