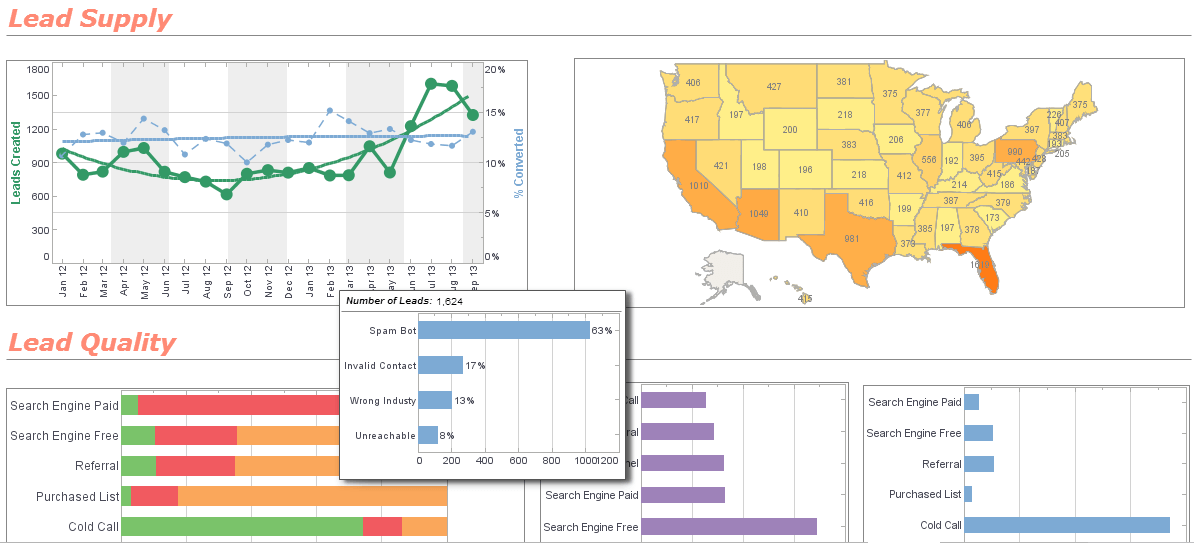
InetSoft's Data Graphing Tools
Are you looking for tools for graphing data? InetSoft provides both free and commercial data graphing tools. View a demo and try them out for free.
Visualize Free is a free visual analysis application. No software to install, just upload your spreadsheet.

LogScale
The LogScale object contains a logarithmic scale, i.e., a scale that logarithmically maps numerical data values to physical attributes (axis position, element size, etc.). To create a LogScale object, call the LogScale constructor.
var qscale = new LogScale('Last Year', 'This Year');
You can pass the names of the fields (e.g., 'Last Year', 'This Year') for which the scale should be generated to the constructor, or specify these later using the inherited Scale.setFields(field) property.
Example (Report or Viewsheet)
importPackage(inetsoft.graph)
importPackage(inetsoft.graph.data)
importPackage(inetsoft.graph.scale)
importPackage(inetsoft.graph.aesthetic)
importPackage(inetsoft.graph.element)
importPackage(inetsoft.graph.coord)

var arr = [["State","Quantity"], ["NJ",200], ["NY",2000]];
dataset = new DefaultDataSet(arr);
graph = new EGraph();
var qscale = new LogScale();
qscale.setFields(["Quantity"]);
var elem = new IntervalElement("State", "Quantity")
graph.setScale("Quantity", qscale);
graph.addElement(elem);
LogScale.setBase(value)
Specifies the base of the logarithmic scale. The default is 10.
Parameter
value
 a number specifying the logarithm base
Example (Report or Viewsheet)
importPackage(inetsoft.graph)
importPackage(inetsoft.graph.data)
importPackage(inetsoft.graph.scale)
importPackage(inetsoft.graph.aesthetic)
importPackage(inetsoft.graph.element)
importPackage(inetsoft.graph.coord)

var arr = [["State", "Quantity"], ["NJ",12], ["NY",450]];
dataset = new DefaultDataSet(arr);
graph = new EGraph();
var qscale = new LogScale("Quantity");
var elem = new IntervalElement("State", "Quantity")
qscale.setBase(2);
graph.setScale("Quantity", qscale);
graph.addElement(elem);
PowerScale
The PowerScale object contains a scale that maps values to physical attributes by raising them to a specified exponent. To create a PowerScale object, call the PowerScale constructor with the fields for which the scale should be generated.
var qscale = new PowerScale('Last Year', 'This Year');
You can pass the names of the fields (e.g., 'Last Year', 'This Year') for which the scale should be generated to the constructor, or specify these later using the inherited Scale.setFields(field) property.
Example (Report or Viewsheet)
importPackage(inetsoft.graph)
importPackage(inetsoft.graph.data)
importPackage(inetsoft.graph.scale)
importPackage(inetsoft.graph.aesthetic)
importPackage(inetsoft.graph.element)
importPackage(inetsoft.graph.coord)

var arr = [["State", "Quantity"], ["NJ",200], ["NY",300]];
dataset = new DefaultDataSet(arr);
graph = new EGraph();
var qscale = new PowerScale();
qscale.setFields(["Quantity"])
var elem = new IntervalElement("State", "Quantity")
qscale.setExponent(0.5);
graph.setScale("Quantity", qscale);
graph.addElement(elem);

PowerScale.setExponent(value)
Specifies the exponent of the scaling. The axis position of value x is given by x^exponent.
Parameter
value
 a number specifying the scaling exponent
Example (Report or Viewsheet)
importPackage(inetsoft.graph)
importPackage(inetsoft.graph.data)
importPackage(inetsoft.graph.scale)
importPackage(inetsoft.graph.aesthetic)
importPackage(inetsoft.graph.element)
importPackage(inetsoft.graph.coord)

var arr = [["State", "Quantity"], ["NJ",200], ["NY",300]];
dataset = new DefaultDataSet(arr);
graph = new EGraph();
var qscale = new PowerScale();
qscale.setFields(["Quantity"])
var elem = new IntervalElement("State", "Quantity")
qscale.setExponent(0.5);
graph.setScale("Quantity", qscale);
graph.addElement(elem);
TimeScale
The TimeScale object contains a time scale, i.e., a scale that linearly maps date and time data values to physical attributes. To create a TimeScale object, call the TimeScale constructor with the fields for which the scale should be generated.
Parameter
var
 qscale = new TimeScale('Date');
You can pass the names of the fields (e.g., 'Date') for which the scale should be generated to the constructor, or specify these later using the inherited Scale.setFields(field) property.
Example (Report or Viewsheet)
importPackage(inetsoft.graph)
importPackage(inetsoft.graph.data)
importPackage(inetsoft.graph.scale)
importPackage(inetsoft.graph.aesthetic)
importPackage(inetsoft.graph.element)
importPackage(inetsoft.graph.coord)

var date1 = new Date();
var date2 = new Date();
var maxDate = new Date();
date1.setFullYear(2008,0,1);
date2.setFullYear(2009,0,1);
maxDate.setFullYear(2011,0,1);
var arr = [["Date", "Quantity"], [date1,200], [date2,300]];
dataset = new DefaultDataSet(arr);
graph = new EGraph();
var elem = new IntervalElement("Date","Quantity")
var tscale = new TimeScale();
tscale.setFields(["Date"]);
tscale.setMax(maxDate);
graph.setScale("Date", tscale);
graph.addElement(elem);
TimeScale.setMax(value)
Specifies the latest date on the scale.
Parameter
value
 a Date object
Example (Report or Viewsheet)
importPackage(inetsoft.graph)
importPackage(inetsoft.graph.data)
importPackage(inetsoft.graph.scale)
importPackage(inetsoft.graph.aesthetic)
importPackage(inetsoft.graph.element)
importPackage(inetsoft.graph.coord)

var date1 = new Date();
var date2 = new Date();
var maxDate = new Date();
date1.setFullYear(2008,0,1);
date2.setFullYear(2009,0,1);
maxDate.setFullYear(2011,0,1);
var arr = [["Date", "Quantity"], [date1,200], [date2,300]];
dataset = new DefaultDataSet(arr);
graph = new EGraph();
var elem = new IntervalElement("Date","Quantity")
var tscale = new TimeScale();
tscale.setFields(["Date"]);
tscale.setMax(maxDate);
graph.setScale("Date", tscale);
graph.addElement(elem);


