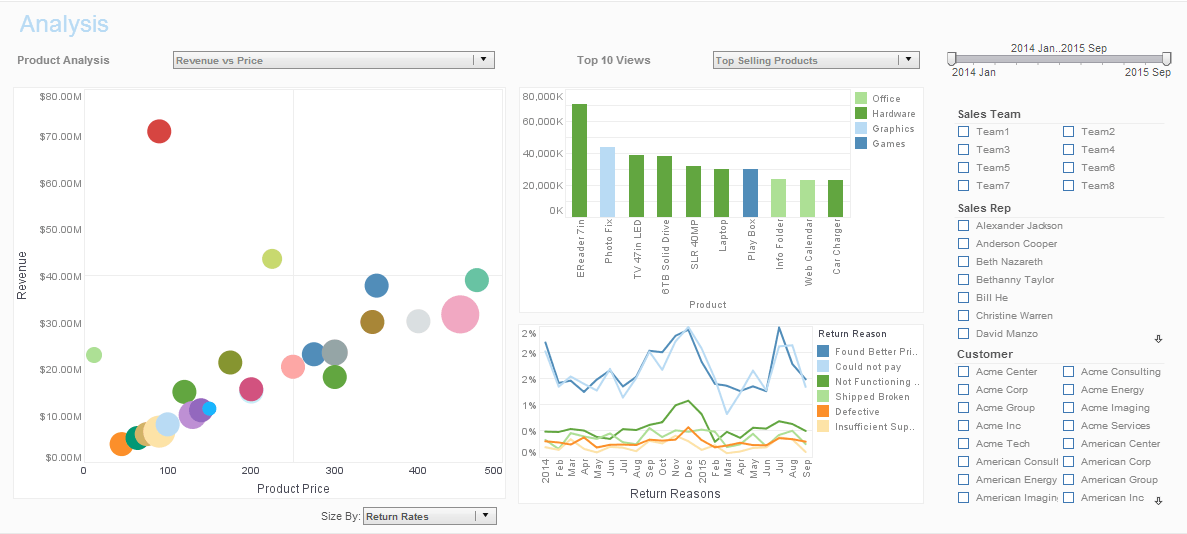
InetSof Product Information: Free Graphing Tools
Looking for free graphing tools? InetSoft provides both free and commercial graphing tools. View a demo and try them out for free. The Start Free button gives you two options for using InetSoft's free dashboard visualization software.
Individual Account
Register with any email address, including free email services such as Google and Yahoo. There is no credit card required. Use the 100% web app with no desktop install. Collaborate online in real time. Use data sources such as uploaded Excel or CSV files or connect to live Google sheets. Publicly share dashboards, if you wish, via URL link. All advanced data visualization types and interactive controls are available.
Business Account
Register with any organizational (business, university, or organization) email address. There is no credit card required. Use the 100% web app with no desktop install. Collaborate online in real time. Use data sources such as uploaded Excel or CSV files or connect to live Google sheets, plus more Google apps, Facebook, databases and many other online data sources. Publicly share dashboards, if you wish, via URL link. Privately share dashboards and analyses within your organization (same email domain). All advanced data visualization types and interactive controls are available.
This excerpt from the API documentation illustrates how developers can control charting in their own cloud application.
PointElement
The PointElement object contains the visual elements for a point (scatter) chart. To create a new PointElement object, call the PointElement constructor.
var elem = new PointElement("State", "Quantity");
You can pass a set of field names (e.g., 'State', 'Quantity') to the constructor, or specify these later using the addDim() and addVar() methods.
Example (Report or Viewsheet) importPackage(inetsoft.graph)
importPackage(inetsoft.graph.data)
importPackage(inetsoft.graph.scale)
importPackage(inetsoft.graph.aesthetic)
importPackage(inetsoft.graph.element)
var arr = [["State", "Quantity"], ["NJ", 200], ["NY", 300]];
dataset = new DefaultDataSet(arr);
graph = new EGraph();
var elem = new PointElement("State", "Quantity")
graph.addElement(elem);
AreaElement
The AreaElement object contains the visual elements for an area chart. To create a new AreaElement object, call the AreaElement constructor.
var elem = new AreaElement("State", "Quantity");
You can pass a set of field names (e.g., 'State', 'Quantity') to the constructor, or specify these later using the addDim() and addVar() methods.
Example (Report or Viewsheet) importPackage(inetsoft.graph)
importPackage(inetsoft.graph.data)
importPackage(inetsoft.graph.scale)
importPackage(inetsoft.graph.aesthetic)
importPackage(inetsoft.graph.element)
var arr = [["State", "Quantity"], ["NJ", 200], ["NY", 300]];
dataset = new DefaultDataSet(arr);
graph = new EGraph();
elem = new AreaElement("State", "Quantity");
graph.addElement(elem);
Chart Coordinates & Scaling
This section discusses objects related to setting chart coordinates and their scaling properties. See Appendix SC.2, Changing Chart Scaling for a tutorial introduction.
Coordinate
The Coordinate object contains the coordinates against which data can be represented.
Full Nameinetsoft.graph.coord.Coordinate
Coordinate.reflect(vert)
Reflect the coordinates about the vertical or horizontal axis.
Parametervert true: reflect about horizontal axis false: reflect about vertical axisExample (Report or Viewsheet)
 importPackage(inetsoft.graph)
 importPackage(inetsoft.graph.data)
 importPackage(inetsoft.graph.scale)
 importPackage(inetsoft.graph.aesthetic)
 importPackage(inetsoft.graph.element)
 importPackage(inetsoft.graph.coord)

 var arr = [["State", "Quantity"], ["NJ", 200], ["NY", 300]];
 dataset = new DefaultDataSet(arr);
 graph = new EGraph();
 var elem = new IntervalElement("State", "Quantity");
 var sscale = new CategoricalScale("State");
 var qscale = new LinearScale("Quantity");
 var coord = new RectCoord(sscale,qscale);
 coord.reflect(true);
 graph.setCoordinate(coord);
 graph.addElement(elem);
Coordinate.rotate(value)
Rotate the axes by the specified angle.
Parametersvalue an Angle in degreesExample (Report or Viewsheet)
 importPackage(inetsoft.graph)
 importPackage(inetsoft.graph.data)
 importPackage(inetsoft.graph.scale)
 importPackage(inetsoft.graph.aesthetic)
 importPackage(inetsoft.graph.element)
 importPackage(inetsoft.graph.coord)

 var arr = [["Direction", "Score"], [(Math.PI/2),20],
            [(Math.PI/4),30], [(Math.PI),35]];
 dataset = new DefaultDataSet(arr);
 graph = new EGraph();
 var elem = new PointElement("Direction", "Score");
 var xscale = new LinearScale("Direction");
 var yscale = new LinearScale("Score");
 yscale.setMin(0);
 yscale.setMax(40);
 xscale.setMin(0);
 xscale.setMax(1.95*Math.PI);
 xscale.setIncrement(Math.PI/8);
 var rect = new RectCoord(xscale,yscale);
 var polar = new PolarCoord(rect);
 polar.rotate(45)
 polar.setType(PolarCoord.THETA);
 graph.setCoordinate(polar);
 graph.addElement(elem);


