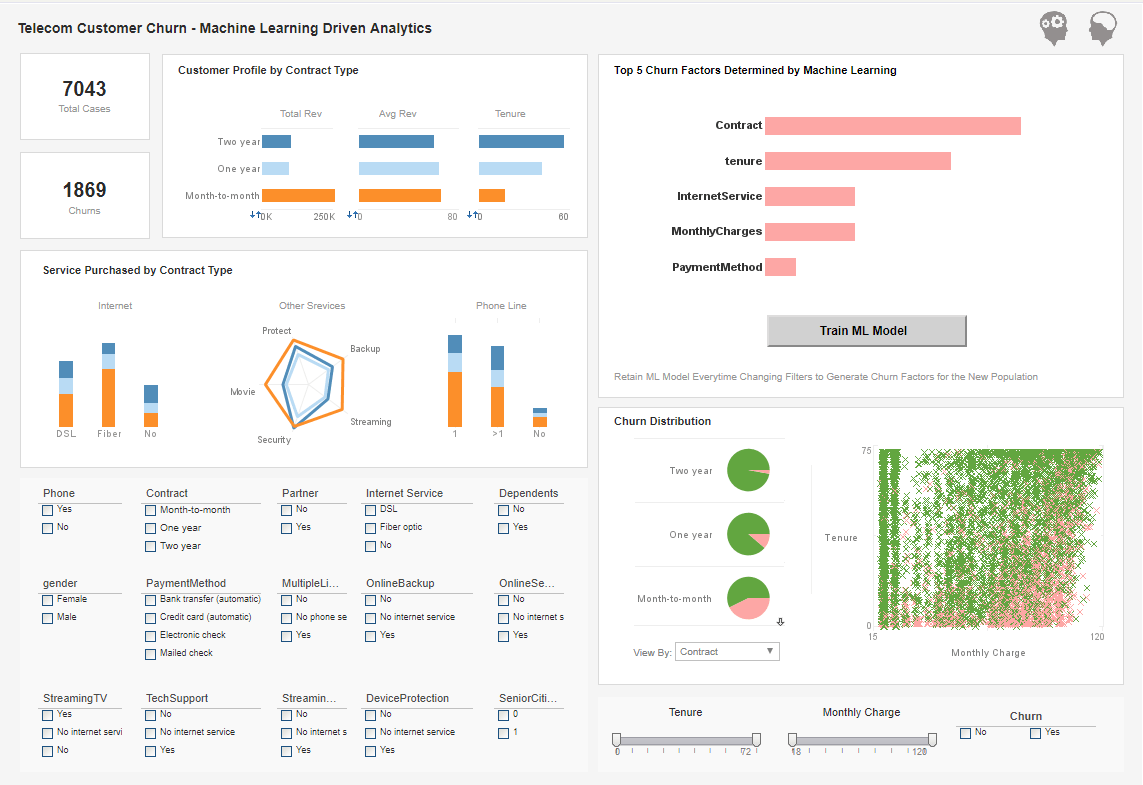
Examples of Graph Objects
Below are some examples of graph charts generated by InetSoft's graph charting engine. And following is documentation on using InetSoft's JavaScript-like API for programmatically generating charts. Alternatively use InetSoft's drag-and-drop chart designer.


Documentation
The EGraph object represents the graph definition. To create a new EGraph object, call the EGraph constructor.
graph = new EGraph();
EGraph.addElement(elem)
Adds the specified GraphElement to the chart. See Chart Elements for available elements.
Parameter
elem a DataSet object
Example (Report or Viewsheet):
importPackage(inetsoft.graph)
importPackage(inetsoft.graph.data)
importPackage(inetsoft.graph.element)
importPackage(inetsoft.graph.aesthetic)
importPackage(inetsoft.graph.guide.form)

var arr = [["State", "Quantity"], ["NJ", 200], ["NY", 300]];
dataset = new DefaultDataSet(arr);
graph = new EGraph();
var elem = new LineElement("State", "Quantity");
graph.addElement(elem);
EGraph.addForm(form)
Adds the specified GraphForm to the chart. See Chart Annotation and Decoration for available forms.
Parameter
form a GraphForm object
Example (Report or Viewsheet):
importPackage(inetsoft.graph)
importPackage(inetsoft.graph.element)
importPackage(inetsoft.graph.scale)
importPackage(inetsoft.graph.aesthetic)
importPackage(inetsoft.graph.data)
importPackage(inetsoft.graph.guide.form)

var arr = [["State", "Quantity"], ["NJ", 200], ["NY", 300]];
dataset = new DefaultDataSet(arr);
graph = new EGraph();
var elem = new IntervalElement("State", "Quantity");
var form = new LineForm();
form.addPoint(new java.awt.Point(0,0));
form.addPoint(new java.awt.Point(100,100));
form.addPoint(new java.awt.Point(200,100));
form.setFill(true);
graph.addForm(form);
graph.addElement(elem);
More Articles About Graphing
Analytics for News and Literary Publishers - Media companies that broadcast breaking news, sports and weather updates use analytics. Book, magazine, film and TV producers and research companies also take advantage of analytical data. Publishers usually access the data they need in visual dashboards. When logged into their interfaces where audience viewing data is stored, they can customize the evaluation parameters. For instance, maybe publishers want to see how many people have watched during a specific time slot and on what type of device. This determines the best slots and locations for ad placement in print, broadcast and book, film or TV productions...
Aviation Load Factor - The proportion of available seating capacity that is filled by passengers is shown by the load factor, a crucial financial KPI. This statistic is used by airlines to maximize revenue and operational effectiveness. Carriers may modify pricing strategies, deploy resources more effectively, and increase total profitability by regularly monitoring load factor fluctuations. By gaining insights into customer demand, load factor analytics help airlines optimize their flight schedules and itineraries...
Cattle Ranching KPIs - In beef cattle ranching, tracking specific Key Performance Indicators (KPIs) and metrics is essential for optimizing operations, improving productivity, and ensuring profitability. Here are some key KPIs and their definitions, along with their significance in performance management.Calving Rate Definition: The percentage of cows that give birth to healthy calves in a given period. Significance: High calving rates indicate good herd fertility and effective breeding practices, crucial for maintaining or increasing herd size and productivity...
Effective Scorecard Design Using InetSoft - First and foremost, to be a useful, a scorecard must track the right key performance indicators. The ultimate goal of creating a scorecard is to identify a select number of business metrics and assign objectives to them. When referred to later on it should be possible to reach a solid conclusion regarding performance versus expectations. Methods for creating a scorecard have evolved many times since they became a popular BI tool. Today there are four main components to consider before creating one...
Homebuilder CRM Project Management - Home builders manage several activities at once and complex project timeframes. Project management-specific KPIs and analytics help to optimize workflow and resource allocation. Project Timeline Adherence: Tracking how closely projects follow their schedules helps in anticipating possible setbacks and initiating remedial measures. Task Completion Rates: This Key Performance Indicator evaluates the effectiveness of project teams by monitoring the proportion of tasks completed within the allotted period...
Essential KPIs for a Product Support Analyst - FRT tracks how quickly a PSA responds to a customer question or concern once it has been raised. A low FRT is crucial since it shows that the assistance procedure is quick and effective. Customers like prompt replies, and a lower FRT may increase client retention and satisfaction. TTR gauges how long it takes a PSA to address a consumer concern once it is raised. A brief TTR suggests effective problem-solving skills, which may raise customer satisfaction and lower turnover...
Magazine Subscription and Revenue Metrics - Tracking metrics connected to subscriptions is crucial for publishers that provide subscription-based business models. Metrics like average revenue per user (ARPU), customer lifetime value (CLTV), and subscriber growth rate provide information on the health of the subscriber base and the total amount of income earned. These data aid in making tactical choices that will increase subscriber retention and draw in new ones...

