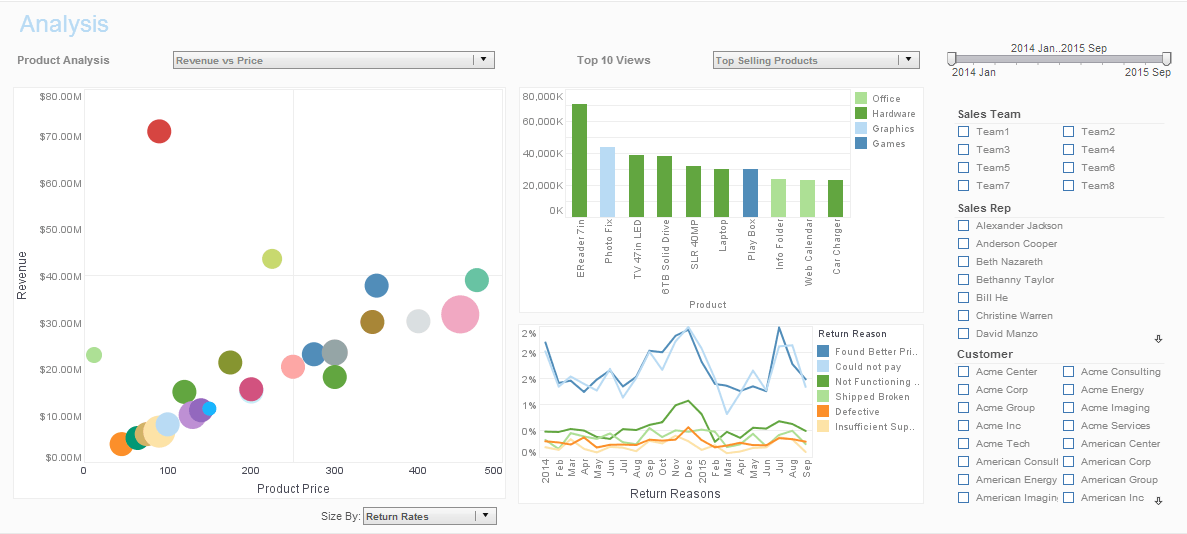
InetSoft Products for Chart Graphing
Looking for tools for graphing a chart? InetSoft provides both free and commercial chart graphing tools. View a demo and try them out for free.
The Start Free button gives you two options for using InetSoft's free dashboard visualization software. Individual Account Register with any email address, including free email services such as Google and Yahoo. There is no credit card required. Use the 100% web app with no desktop install. Collaborate online in real time. Use data sources such as uploaded Excel or CSV files or connect to live Google sheets. Publicly share dashboards, if you wish, via URL link. All advanced data visualization types and interactive controls are available.
For the Business Account choice, register with any organizational (business, university, or organization) email address. There is no credit card required. Use the 100% web app with no desktop install. Collaborate online in real time. Use data sources such as uploaded Excel or CSV files or connect to live Google sheets, plus more Google apps, Facebook, databases and many other online data sources. Publicly share dashboards, if you wish, via URL link. Privately share dashboards and analyses within your organization (same email domain). All advanced data visualization types and interactive controls are available.
StackRange.setGroupField(value)
Determines the scale range from the stacked values of largest single group, based on the specified grouping field.
Parameter
value
 the field name, a String
Example (Report or Viewsheet)
importPackage(inetsoft.graph)
importPackage(inetsoft.graph.data)
importPackage(inetsoft.graph.scale)
importPackage(inetsoft.graph.aesthetic)
importPackage(inetsoft.graph.element)
importPackage(inetsoft.graph.coord)

var arr = [["State", "Quantity"], ["NJ",200], ["NJ",100],
           ["NY",400],["NY",300]];
dataset = new DefaultDataSet(arr);
graph = new EGraph();
var qscale = new LinearScale("Quantity");
var elem = new PointElement("State", "Quantity")
range = new StackRange();
range.setGroupField("State"); // max of 200+100, 400+300
qscale.setScaleRange(range);
graph.setScale("Quantity", qscale);
graph.addElement(elem);
| #1 Ranking: Read how InetSoft was rated #1 for user adoption in G2's user survey-based index | Read More |
StackRange.setStackNegative(boolean)
Specifies whether the negative scale range is determine by independently stacking the negative values (default), or whether stacking is not applied to negative values in computing the range.
Parameter
Boolean
 true: stack negative values to get range
 false: do not stack negative values
Example (Report or Viewsheet)
importPackage(inetsoft.graph)
importPackage(inetsoft.graph.data)
importPackage(inetsoft.graph.scale)
importPackage(inetsoft.graph.aesthetic)
importPackage(inetsoft.graph.element)
importPackage(inetsoft.graph.coord)

var arr = [["State", "Quantity"],
           ["NJ",200],["NJ",100],["NY",-300],["NY",-400]];
dataset = new DefaultDataSet(arr);
graph = new EGraph();
var qscale = new LinearScale("Quantity");
var elem = new IntervalElement("State", "Quantity")
range = new StackRange();
range.setStackNegative(false);
qscale.setScaleRange(range);
graph.setScale("Quantity", qscale);
graph.addElement(elem);
 |
View live interactive examples in InetSoft's dashboard and visualization gallery. |
LinearRange
The LinearRange object computes the range by using the minimum and maximum data values. To create a LinearRange object, call the LinearRange constructor.
var range = new LinearRange();
Example (Report or Viewsheet)
importPackage(inetsoft.graph)
importPackage(inetsoft.graph.data)
importPackage(inetsoft.graph.scale)
importPackage(inetsoft.graph.aesthetic)
importPackage(inetsoft.graph.element)
importPackage(inetsoft.graph.coord)

var arr = [["State", "Quantity"],["NJ",-200],["NY",300]];
dataset = new DefaultDataSet(arr);
graph = new EGraph();
var qscale = new LinearScale("Quantity");
var elem = new IntervalElement("State", "Quantity")
range = new LinearRange();
qscale.setScaleRange(range);
graph.setScale("Quantity", qscale);
graph.addElement(elem);
Chart Aesthetics
This section discusses the VisualFrame objects that can be added to chart elements to introduce visual style. VisualFrame objects allow you to represent additional data dimensions by using the physical attributes of chart elements, or to apply a fixed (static) visual style.
Read what InetSoft customers and partners have said about their selection of Style Report as their production reporting tool. |
VisualFrame
The VisualFrame object contains common properties for all aesthetic frames.
VisualFrame.setField(field)
Specifies the field (column) associated with this frame.
Parameter
field
 name of the column (String)
Example (Report or Viewsheet)
importPackage(inetsoft.graph)
importPackage(inetsoft.graph.data)
importPackage(inetsoft.graph.scale)
importPackage(inetsoft.graph.aesthetic)
importPackage(inetsoft.graph.element)
importPackage(inetsoft.graph.coord)

var arr = [["State", "Quantity"], ["NJ",200], ["NY",300]];
dataset = new DefaultDataSet(arr);
graph = new EGraph();
var elem = new IntervalElement("State", "Quantity");
var frame = new BrightnessColorFrame();
frame.setField("Quantity");
frame.setColor(java.awt.Color(0xff0000));
elem.setColorFrame(frame);
graph.addElement(elem);
Learn how InetSoft's data intelligence technology is central to delivering efficient business intelligence. |
VisualFrame.setLegendSpec(spec)
Specifies the formatting for the legend generated for the scale.
Parameter
spec
 a LegendSpec object
You can pass the names of the fields (e.g., 'Date') for which the scale should be generated to the constructor, or specify these later using the inherited Scale.setFields(field) property.
Example (Report or Viewsheet)
importPackage(inetsoft.graph)
importPackage(inetsoft.graph.data)
importPackage(inetsoft.graph.scale)
importPackage(inetsoft.graph.aesthetic)
importPackage(inetsoft.graph.element)
importPackage(inetsoft.graph.coord)

var arr = [["State", "Quantity"], ["NJ",200], ["NY",300]];
dataset = new DefaultDataSet(arr);
graph = new EGraph();
var elem = new PointElement("State", "Quantity");
var frame = new LinearSizeFrame();
var spec = new LegendSpec();
spec.setBorderColor(java.awt.Color(0xff0000));
frame.setField("Quantity");
frame.setLegendSpec(spec);
elem.setSizeFrame(frame);
graph.addElement(elem);
 |
Learn how InetSoft's data intelligence technology is central to delivering efficient business intelligence. |
VisualFrame.setScale(scale)
Specifies the scale associated with this frame.
Parameter
scale
 a Scale object
Example (Report or Viewsheet)
importPackage(inetsoft.graph)
importPackage(inetsoft.graph.data)
importPackage(inetsoft.graph.scale)
importPackage(inetsoft.graph.aesthetic)
importPackage(inetsoft.graph.element)
importPackage(inetsoft.graph.coord)

var arr = [["State", "Quantity"], ["NJ",200], ["NY",300]];
dataset = new DefaultDataSet(arr);
graph = new EGraph();
var elem = new IntervalElement("State", "Quantity");
var frame = new BrightnessColorFrame();
frame.setField("Quantity");
var scale = new LinearScale();
scale.setMax(325);
scale.setMin(175);
frame.setScale(scale);
frame.setColor(java.awt.Color(0xff0000));
elem.setColorFrame(frame);
graph.addElement(elem);
| Previous: Graph Program |
Next: Dynamic Charts
|


